
In good shape 🟢🟨
I came across QGIS early while learning Tableau, after seeing my favourite map wizard Dennis Kao share how he uses it in his craft on Twitter in 2023. Ever since, I’ve been playing with QGIS in the background and discovering some really nice ways to use it.
Today I’m going to show you how to turn any SVG shape into a polygon in Tableau, with a little help from QGIS! ✨

I’ve already written a blog on how to make custom Polygon Charts in Tableau using an InterWorks tool. However, that approach is more manual when it comes to plotting polygons.
Having played with both, I find myself using this QGIS method more and more. While it may seem like more steps at first, once you try it, you’ll notice how much time it saves. And as you’ll see in my next blog, we can even take this further 😉
What is an SVG and QGIS?
Here’s a quick summary on what SVGs and QGIS are 🙂
📐 SVG – Scalable Vector Graphic
It’s a type of image made up of paths (lines and shapes) rather than pixels.
This means you can resize it as much as you like without it becoming blurry, and you can edit the shape itself because it’s built from coordinates.
🌍 QGIS – An open source mapping tool used to work with spatial data.
It lets you view, edit, and transform shapes like points, lines, and polygons, making it really useful for preparing data for maps and visualisations.
Here’s how…
Step 1: Pick an SVG
You can find a pre-existing SVG shape or create your own in Figma and export it as an SVG.
Good websites to find pre-existing ones:
- The Noun Project
- SVG Repo
- Flat Icon
For this demo, I’ll be using a blossom flower SVG I created in Figma, which includes lines for ranking.
If you’d like to create something similar, I’ve written a tutorial on shape transformations in Figma.

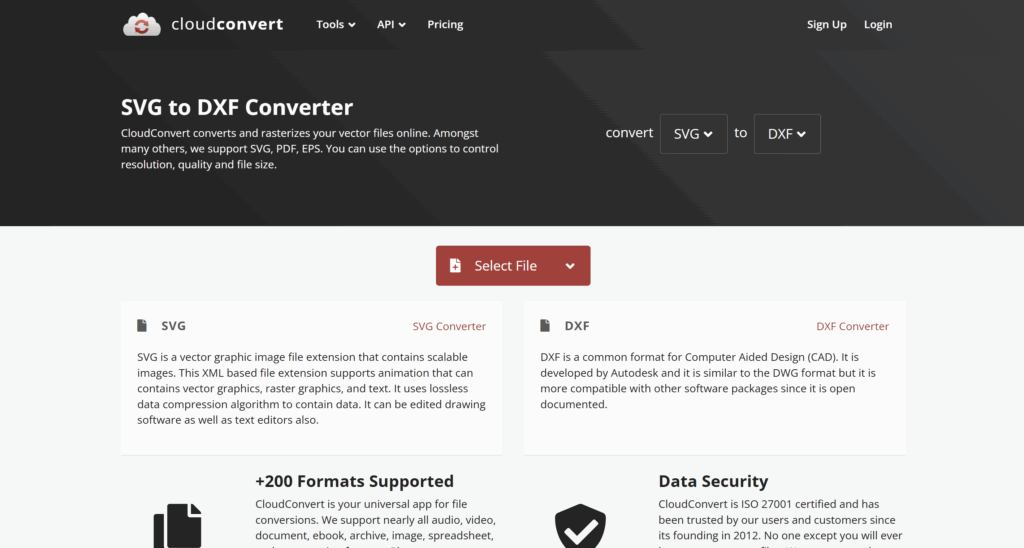
Step 2: Convert it to a DXF
Using an online SVG to DXF converter, upload your SVG file and download the DXF output.
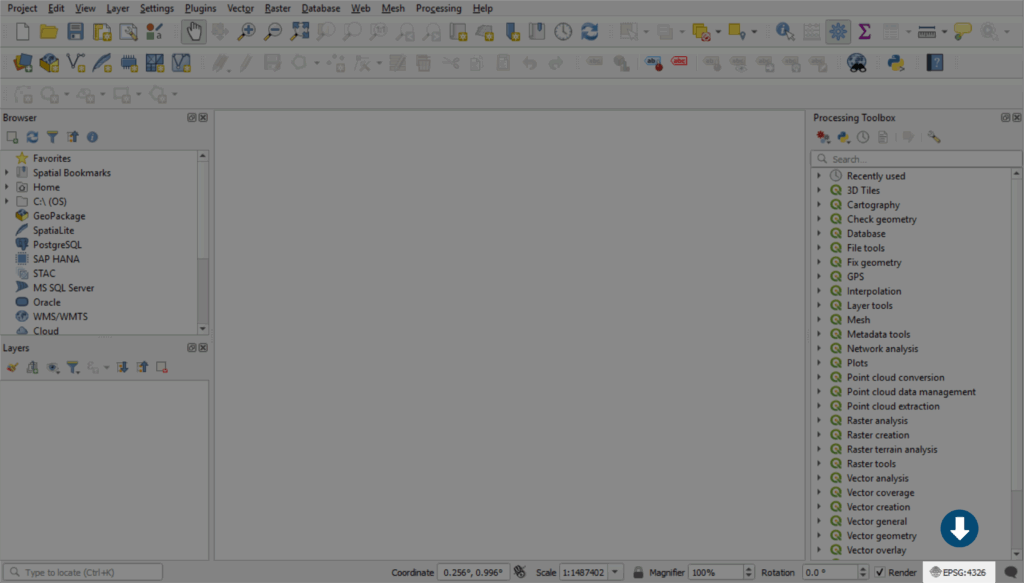
Step 3: Set up QGIS
If you haven’t already, download and install QGIS Desktop (free). I left my installation settings as default.
Open a new Project file in QGIS. Change the project CRS to ‘Pseudo-Mercator’. This can be done by clicking on the CRS in the bottom right corner.
This will open up the Project Coordinate Reference System (CRS) menu. Seach for EPSG: 3857 and select the following option. Press OK to change.
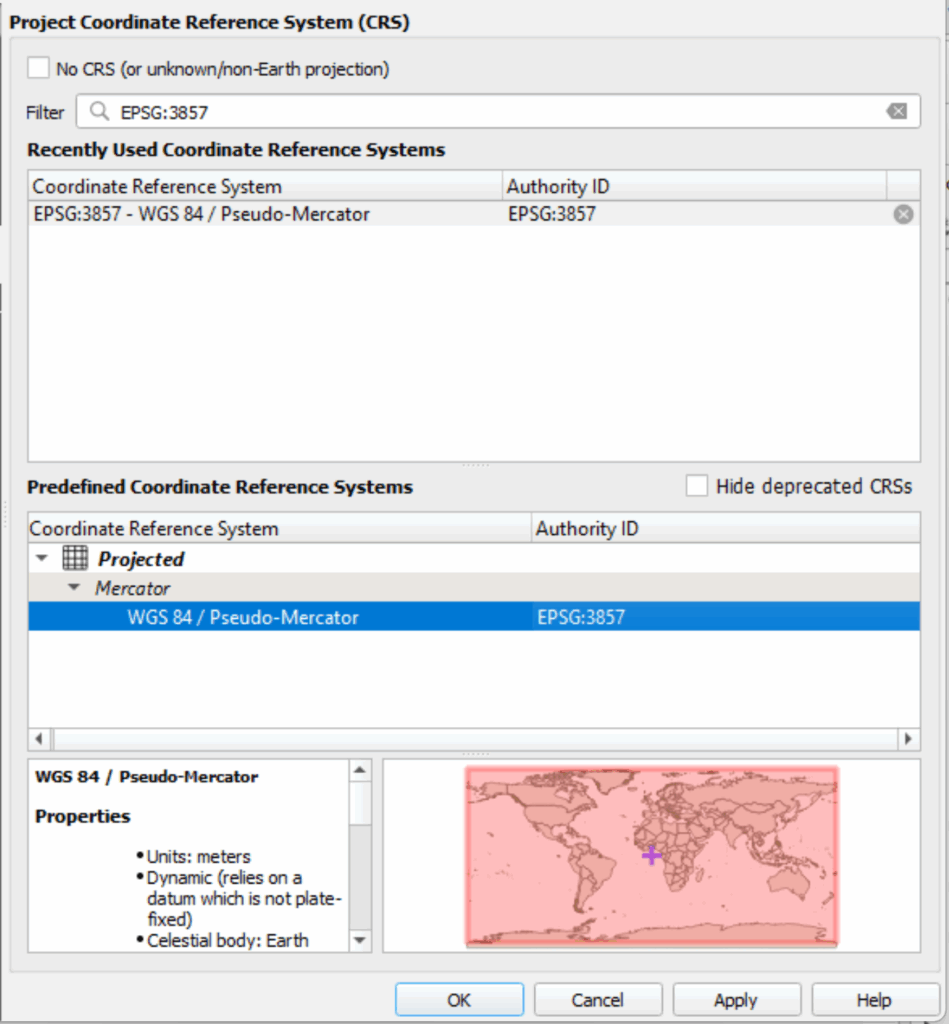
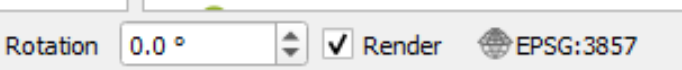
You should now see the bottom of your screen say EPSG: 3857
Step 4: Open the DXF file
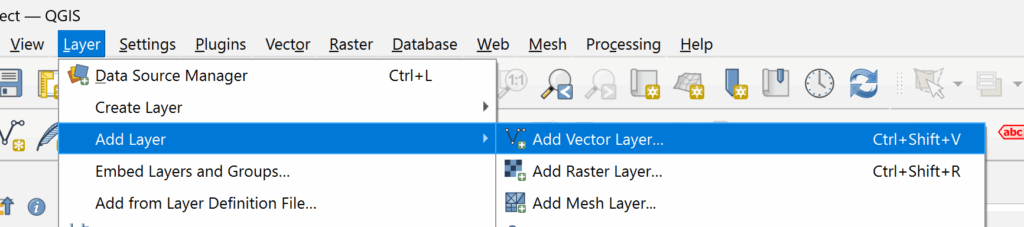
To open your DXF file, go to Layer > Add Layer > Add Vector Layer in the top toolbar. This will open up a menu.
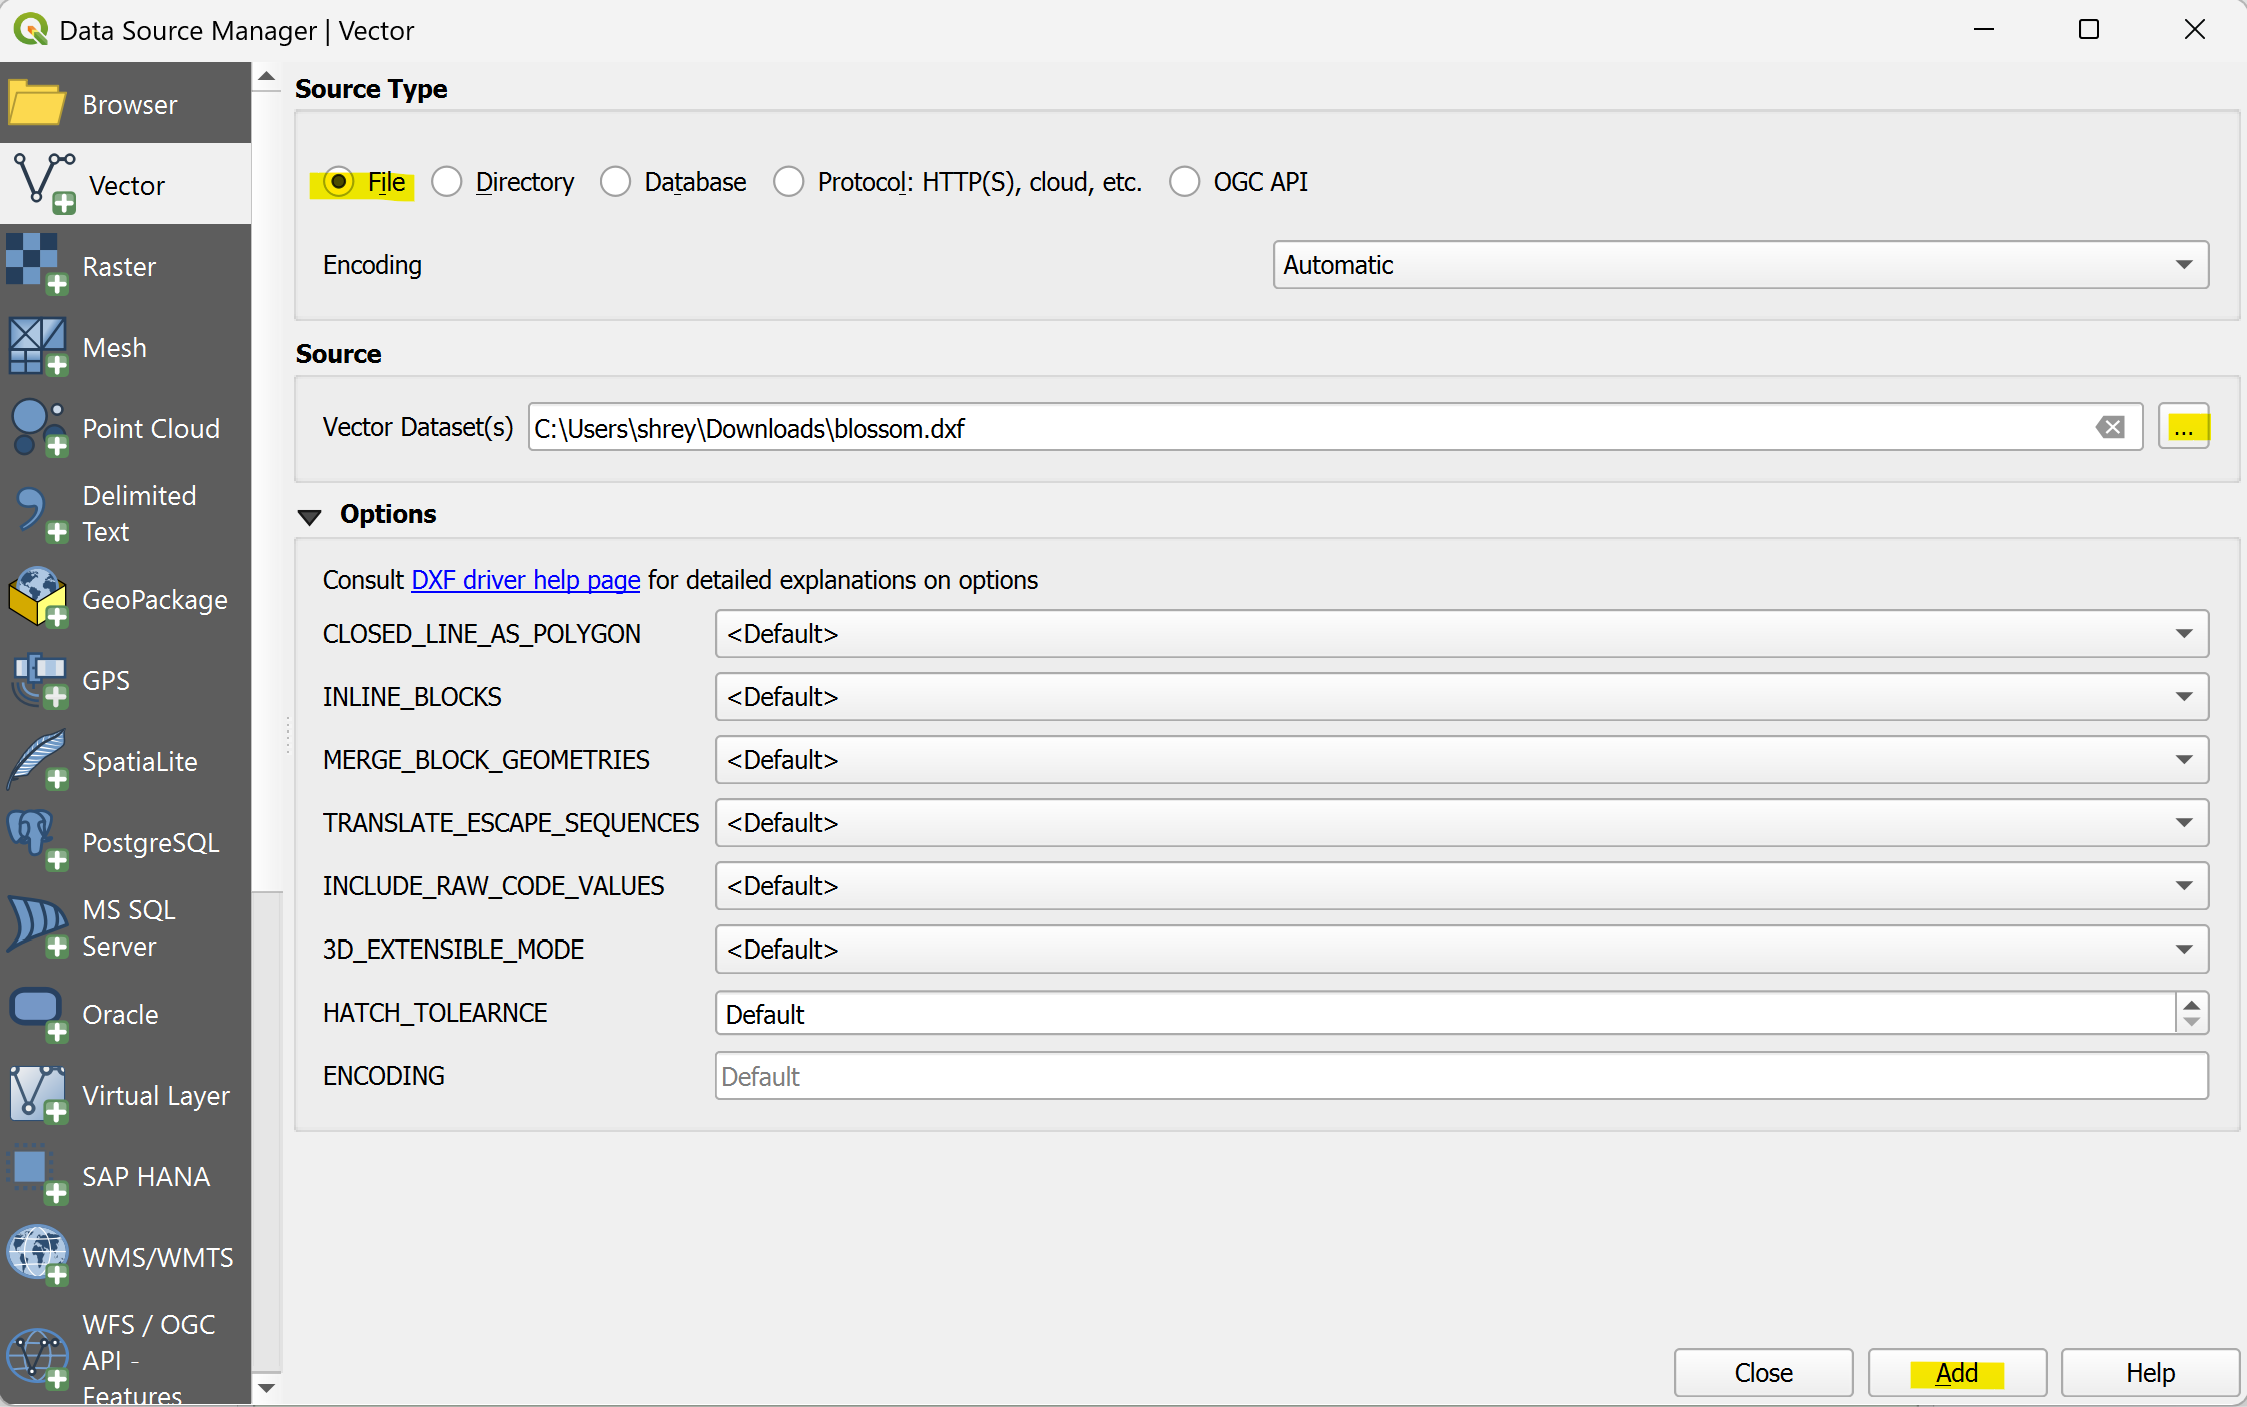
Under Source, click the three dots (…) and select your DXF file.
Leave the other options as default, then press Add.
A second menu will pop up, showing a LineString. Click on ‘Add Layers‘.
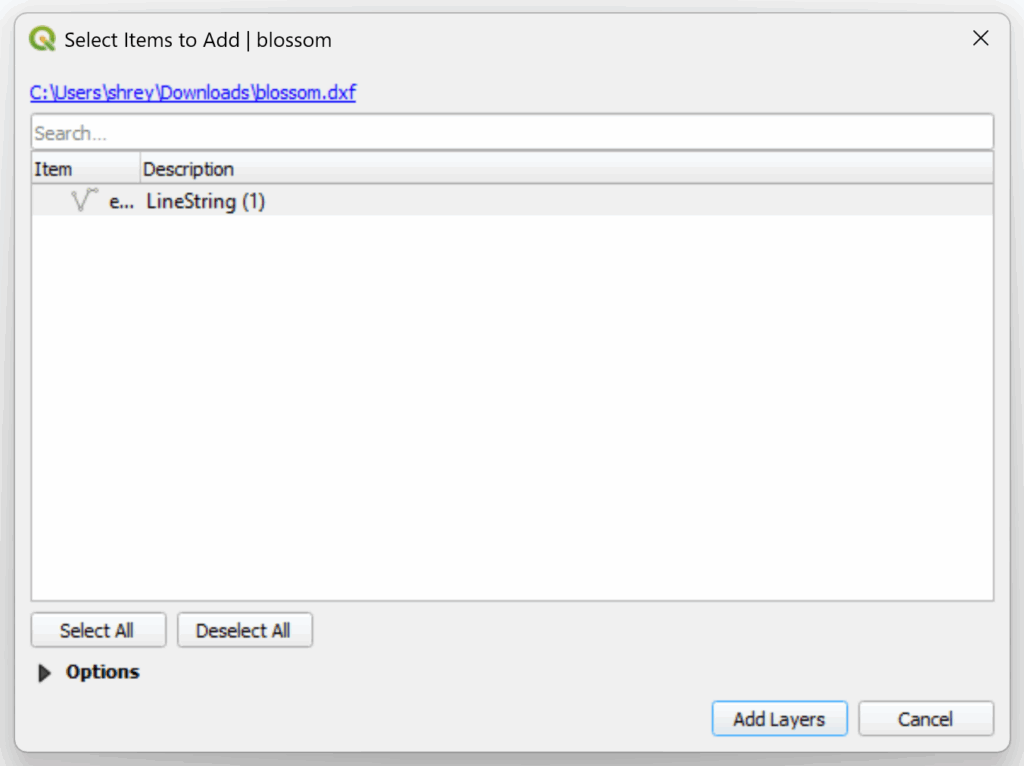
This will create an outline of your SVG shape!

Step 5: Turn the Line Into a Polygon
Now let’s turn this outline into a polygon.
From the top toolbar, go to Vector > Geometry Tools > Lines to Polygons.
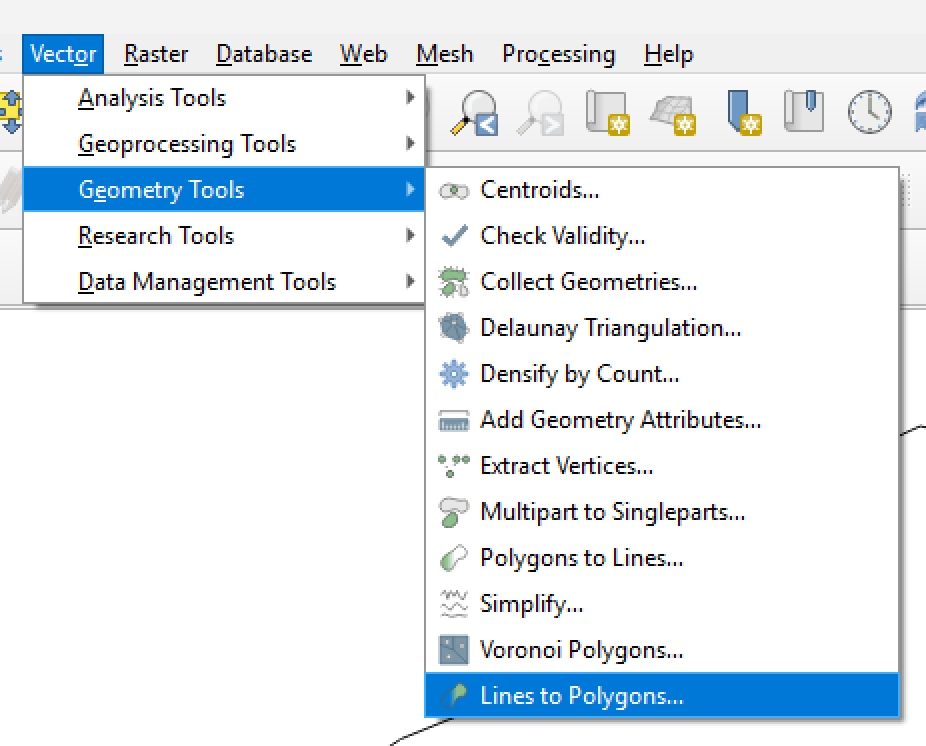
The Input layer should be your outline. Leave the other settings as default and press Run.
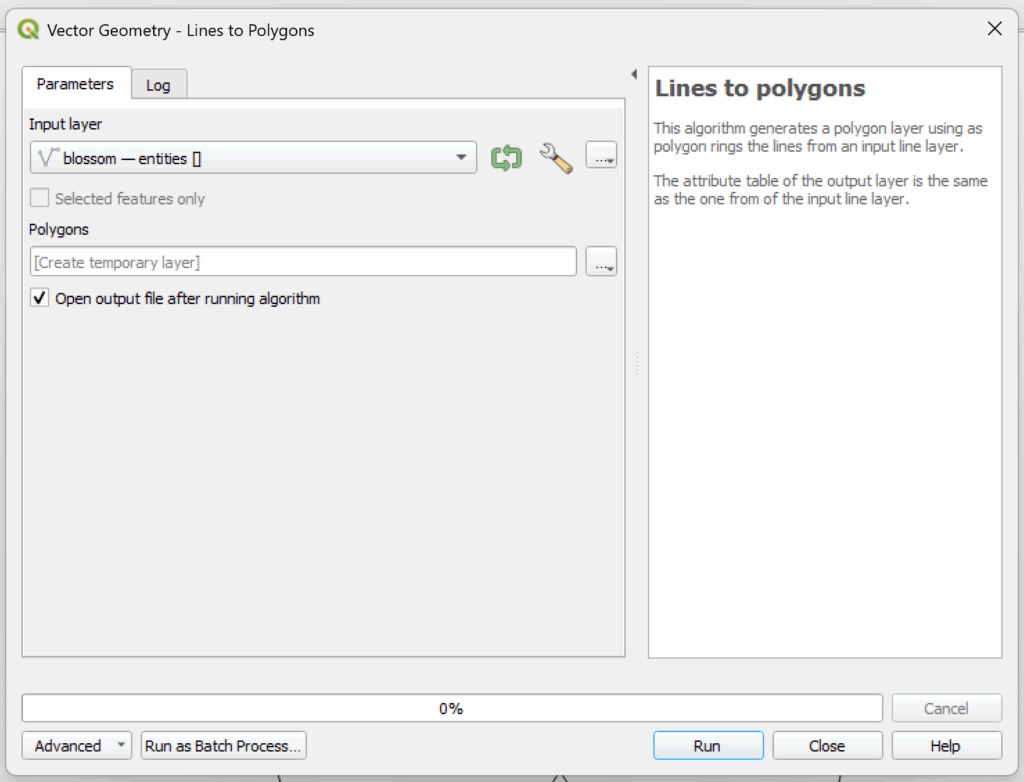
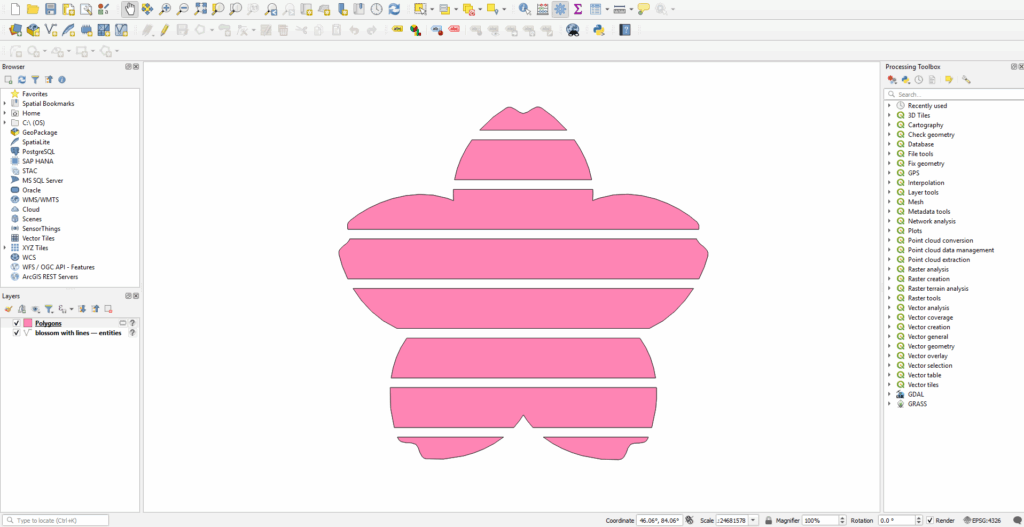
You should now see a second layer called “Polygons“, which is your filled shape!
🎨 The colour of the polygon doesn’t matter here, it will be randomly assigned upon creation.
Step 6: Adding IDs / Removing Fields
Adding IDs
If your polygon has multiple parts, it’s helpful to assign an ID to each section.
(You can skip this if your shape is a single polygon.)
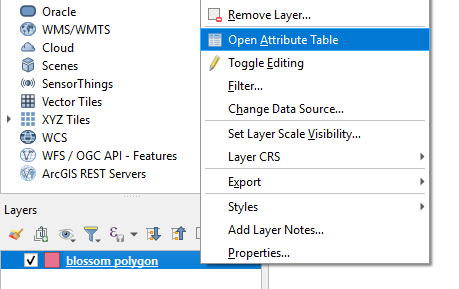
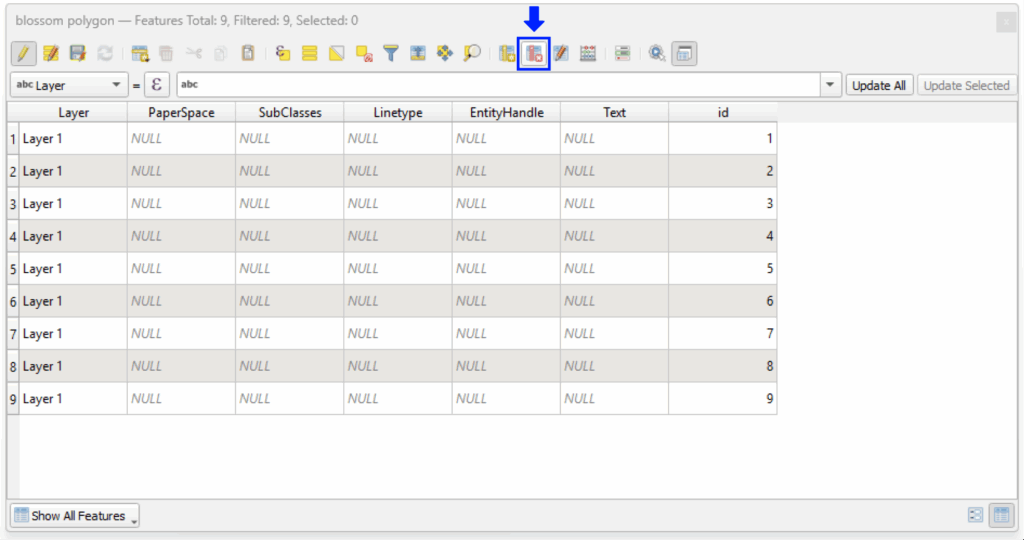
Right-click on your polygon layer > Open Attribute Table
Click on the Abacus icon to create a new field.
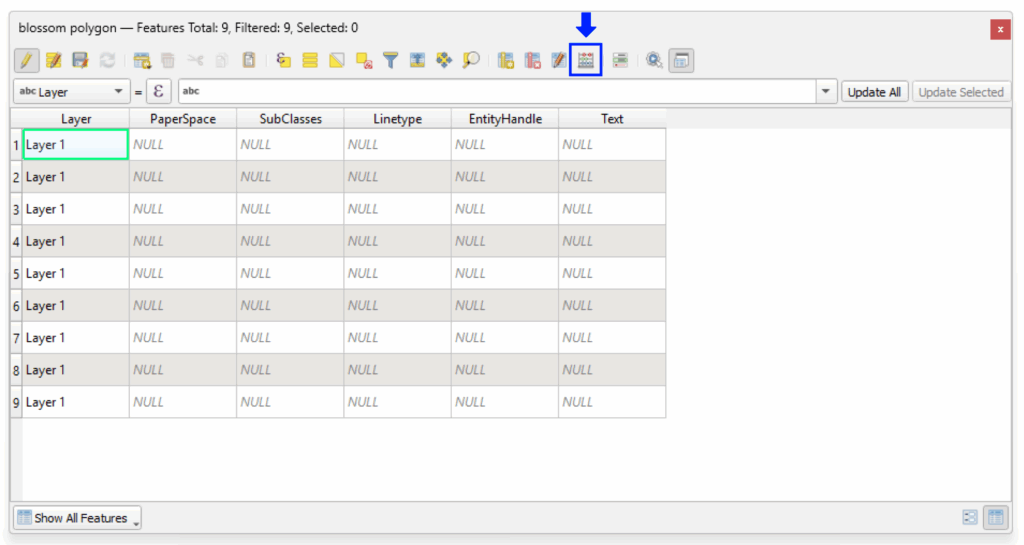
Configure as shown below:
- Field Name: id
- Field type: Integer
- Expression: @row_number
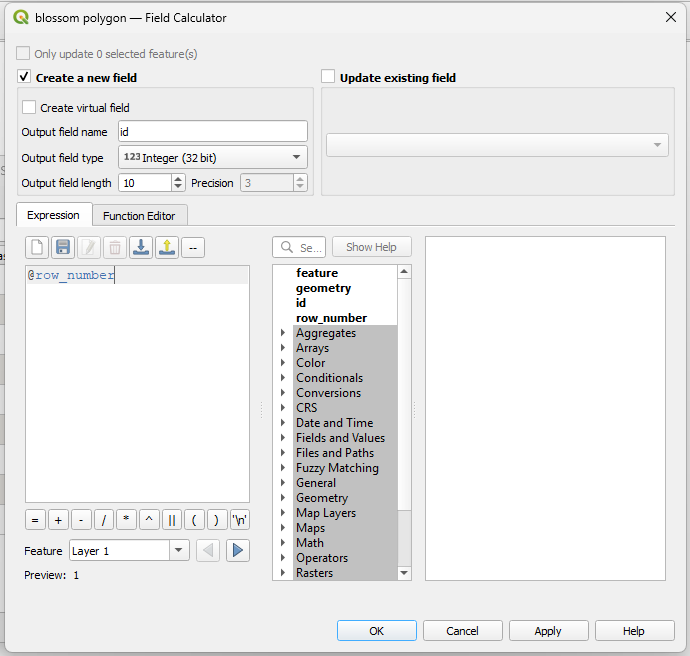
Press OK to generate a unique ID for each polygon.
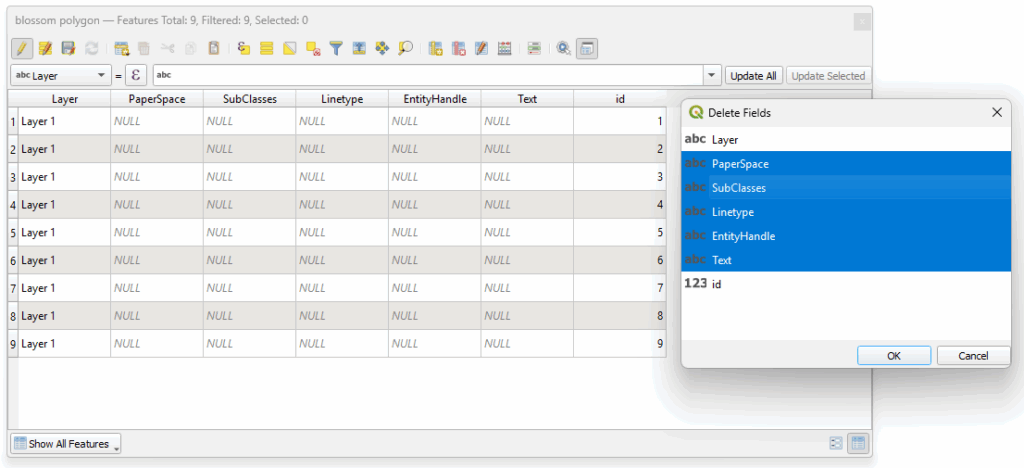
Removing Fields
Some fields will be automatically created and may be empty. Let’s remove these.
Click the column icon with an X
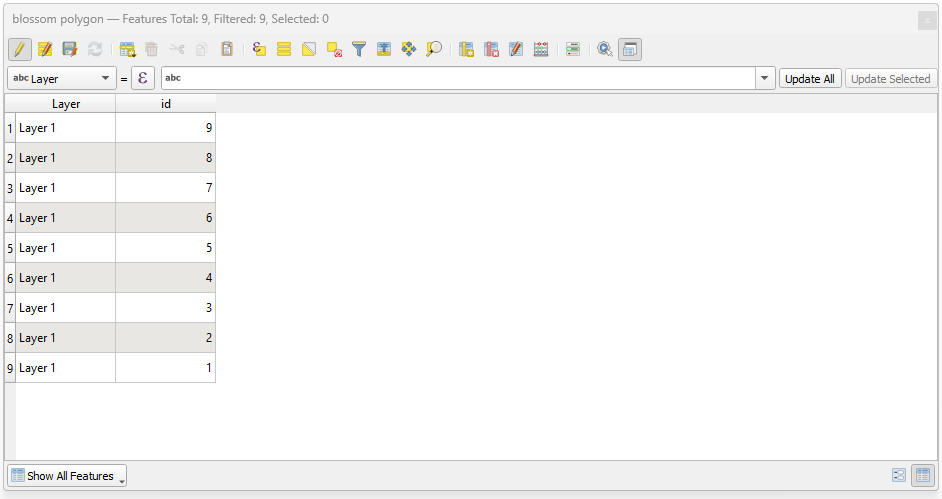
Select the fields you’d like to remove (e.g. null fields), then press OK.
And now you’re ready to export ✨
Step 7: Export the Polygon Layer
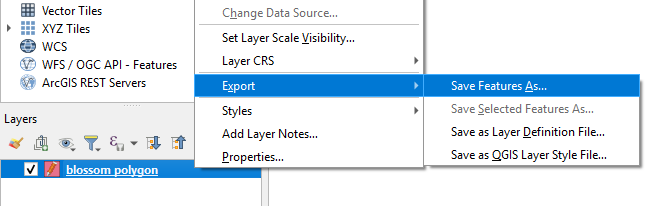
In the layers pane, right-click your polygon layer > Export > Save Features As.
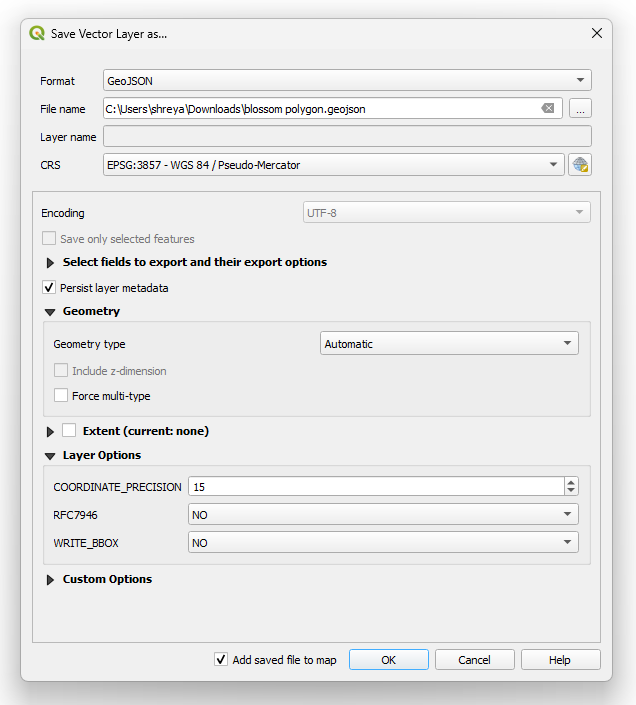
This will open the following menu. We’ll be exporting our Polygon as a GeoJSON file.
Click on the three dots (…) next to File name to select where you’d like to save the GeoJSON. Leave the remaining settings as default, then press OK.
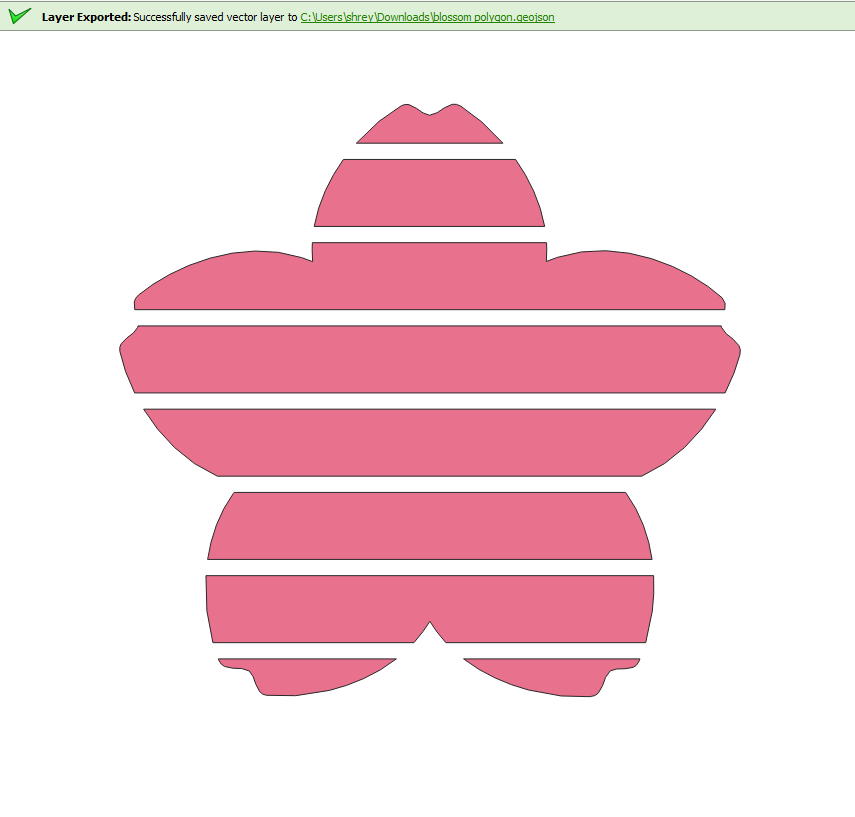
You should get a successful Layer Exported message at the top 🙂
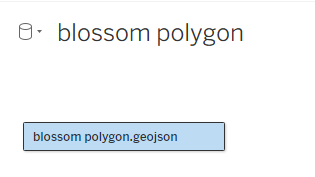
Step 8: Open your GeoJSON in Tableau
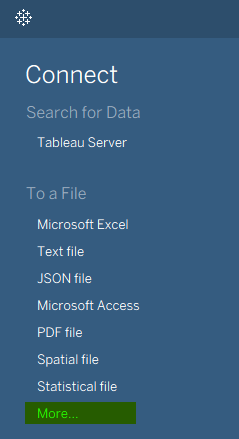
Open up Tableau Desktop and connect to your data by clicking on More… from the blue data pane, or directly selecting Spatial File.
While there is a specific option for spatial files, I prefer clicking “More…” as it lets me see all file types instead of restricting the view. Personal preference 🙂
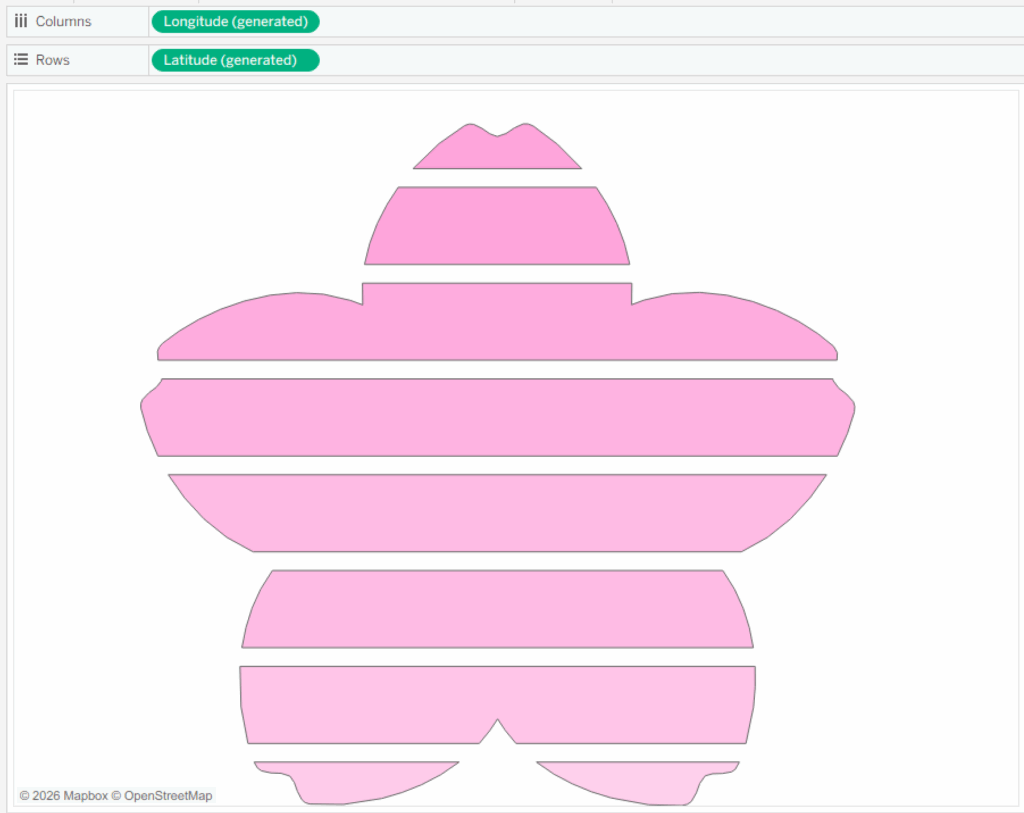
Navigate to a blank worksheet. Double-click on the field ‘Geometry‘ to plot your polygon.
If you have multiple polygons and followed Step 6, also drag Id onto detail.
And now you have your beautiful polygon! 😀
Final Thoughts
Like I mentioned earlier, this method is less time-consuming than my previous approach to plotting polygon shapes in Tableau, and it’s quickly become my go-to.
The main advantage is that you don’t need to manually trace and draw each point. And if you’d like, you can turn this into something like a top 10 ranking polygon, or play around with different ways to encode the data 🙂
If you find this tutorial helpful and give this method a go, I’d love to see what you create! Feel free to tag me @datavizfairy on Twitter / X or Shreya Arya on LinkedIn ✨