
data viz
fairy
finding magic in everyday data ✨
Sharing some blogs, tips and my perspective as I continue to grow my data visualisation skills

A spring full of British blossoms…

A spring full of British blossoms…

World Happiness Report 2024

Walt Disney Movies

My Tableau Journey

Hi, I’m Shreya 🌸
I specialise in data visualisation and analytics.
With a passion for creative design, I enjoy transforming data into clear and visually engaging insights — helping organisations unlock the full potential of their data.
Tableau Conference 2024 · Vizzie Award
Best Designer
“KYOTO, JAPAN | Cherry Blossom Seasonality”
Awarded at Tableau Conference to an individual whose work demonstrates exceptional visual design and a talent for creating beautiful, informative visualisations.
View the viz →

Tableau Visionary

Tableau Ambassador
Viz of the Day Features
Iron Viz Runner-up

Back 2 Viz Basics Co-lead
Conference Speaker

Data2Kids Awards

Data ChangeMakers
DataFam Days 2026
DataFam Europe
From the blog
Step-by-step guides, tutorials & magic ☁️
-

How to build an Elevator and File path display in Tableau
What is an elevator and file path display? An elevator and file-path display are two supporting visuals that help users understand where…
-
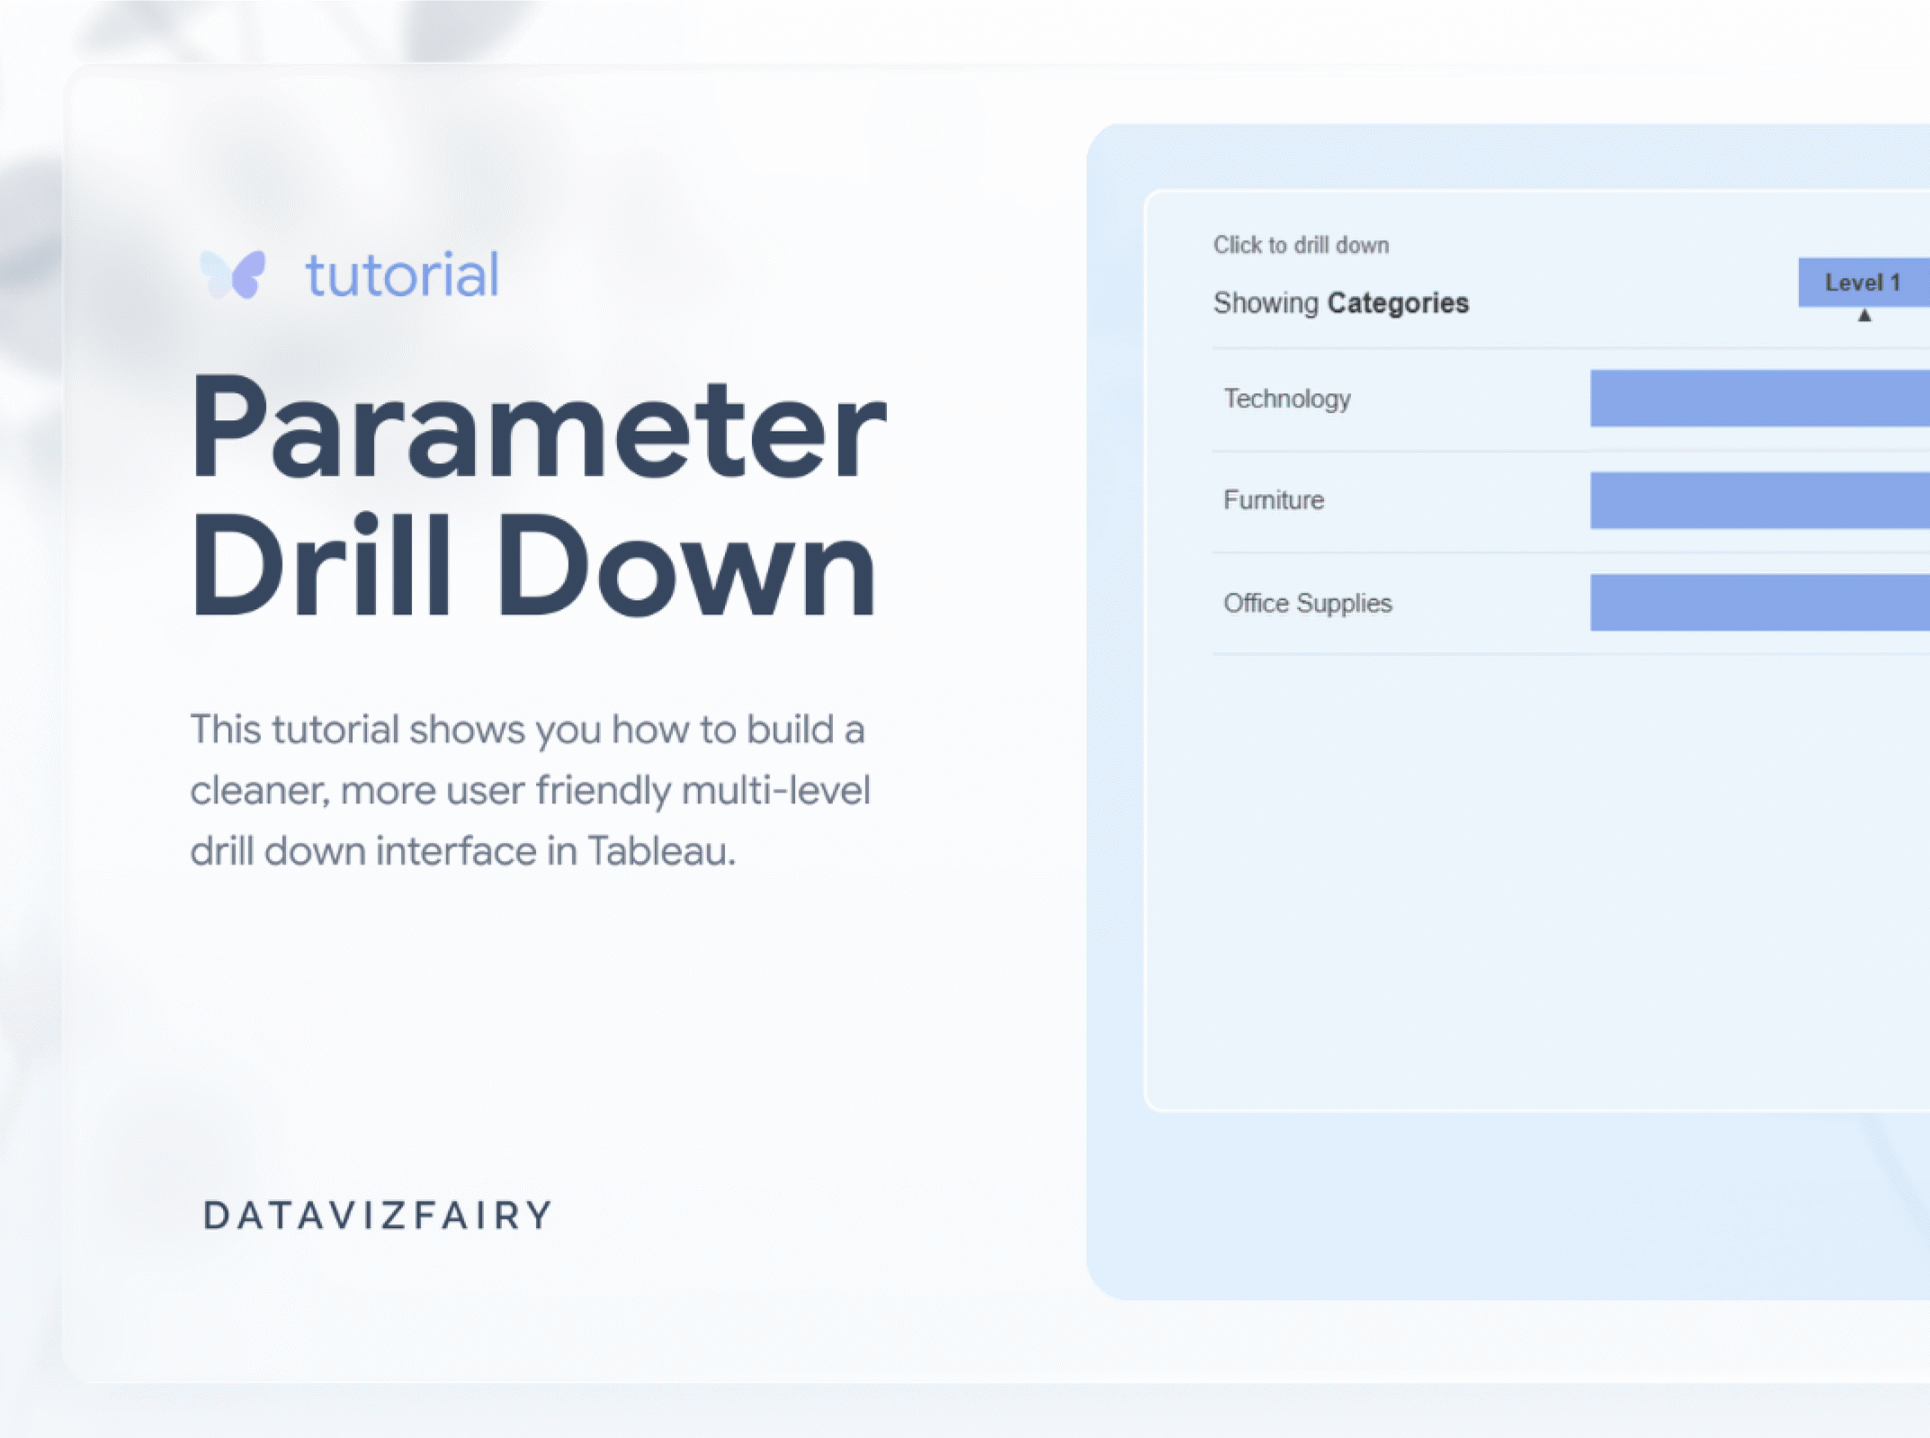
How to build a Parameter Drill-down in Tableau
What is a drill down? A drill down in Tableau lets you start with a high-level view, such as total sales by…
-
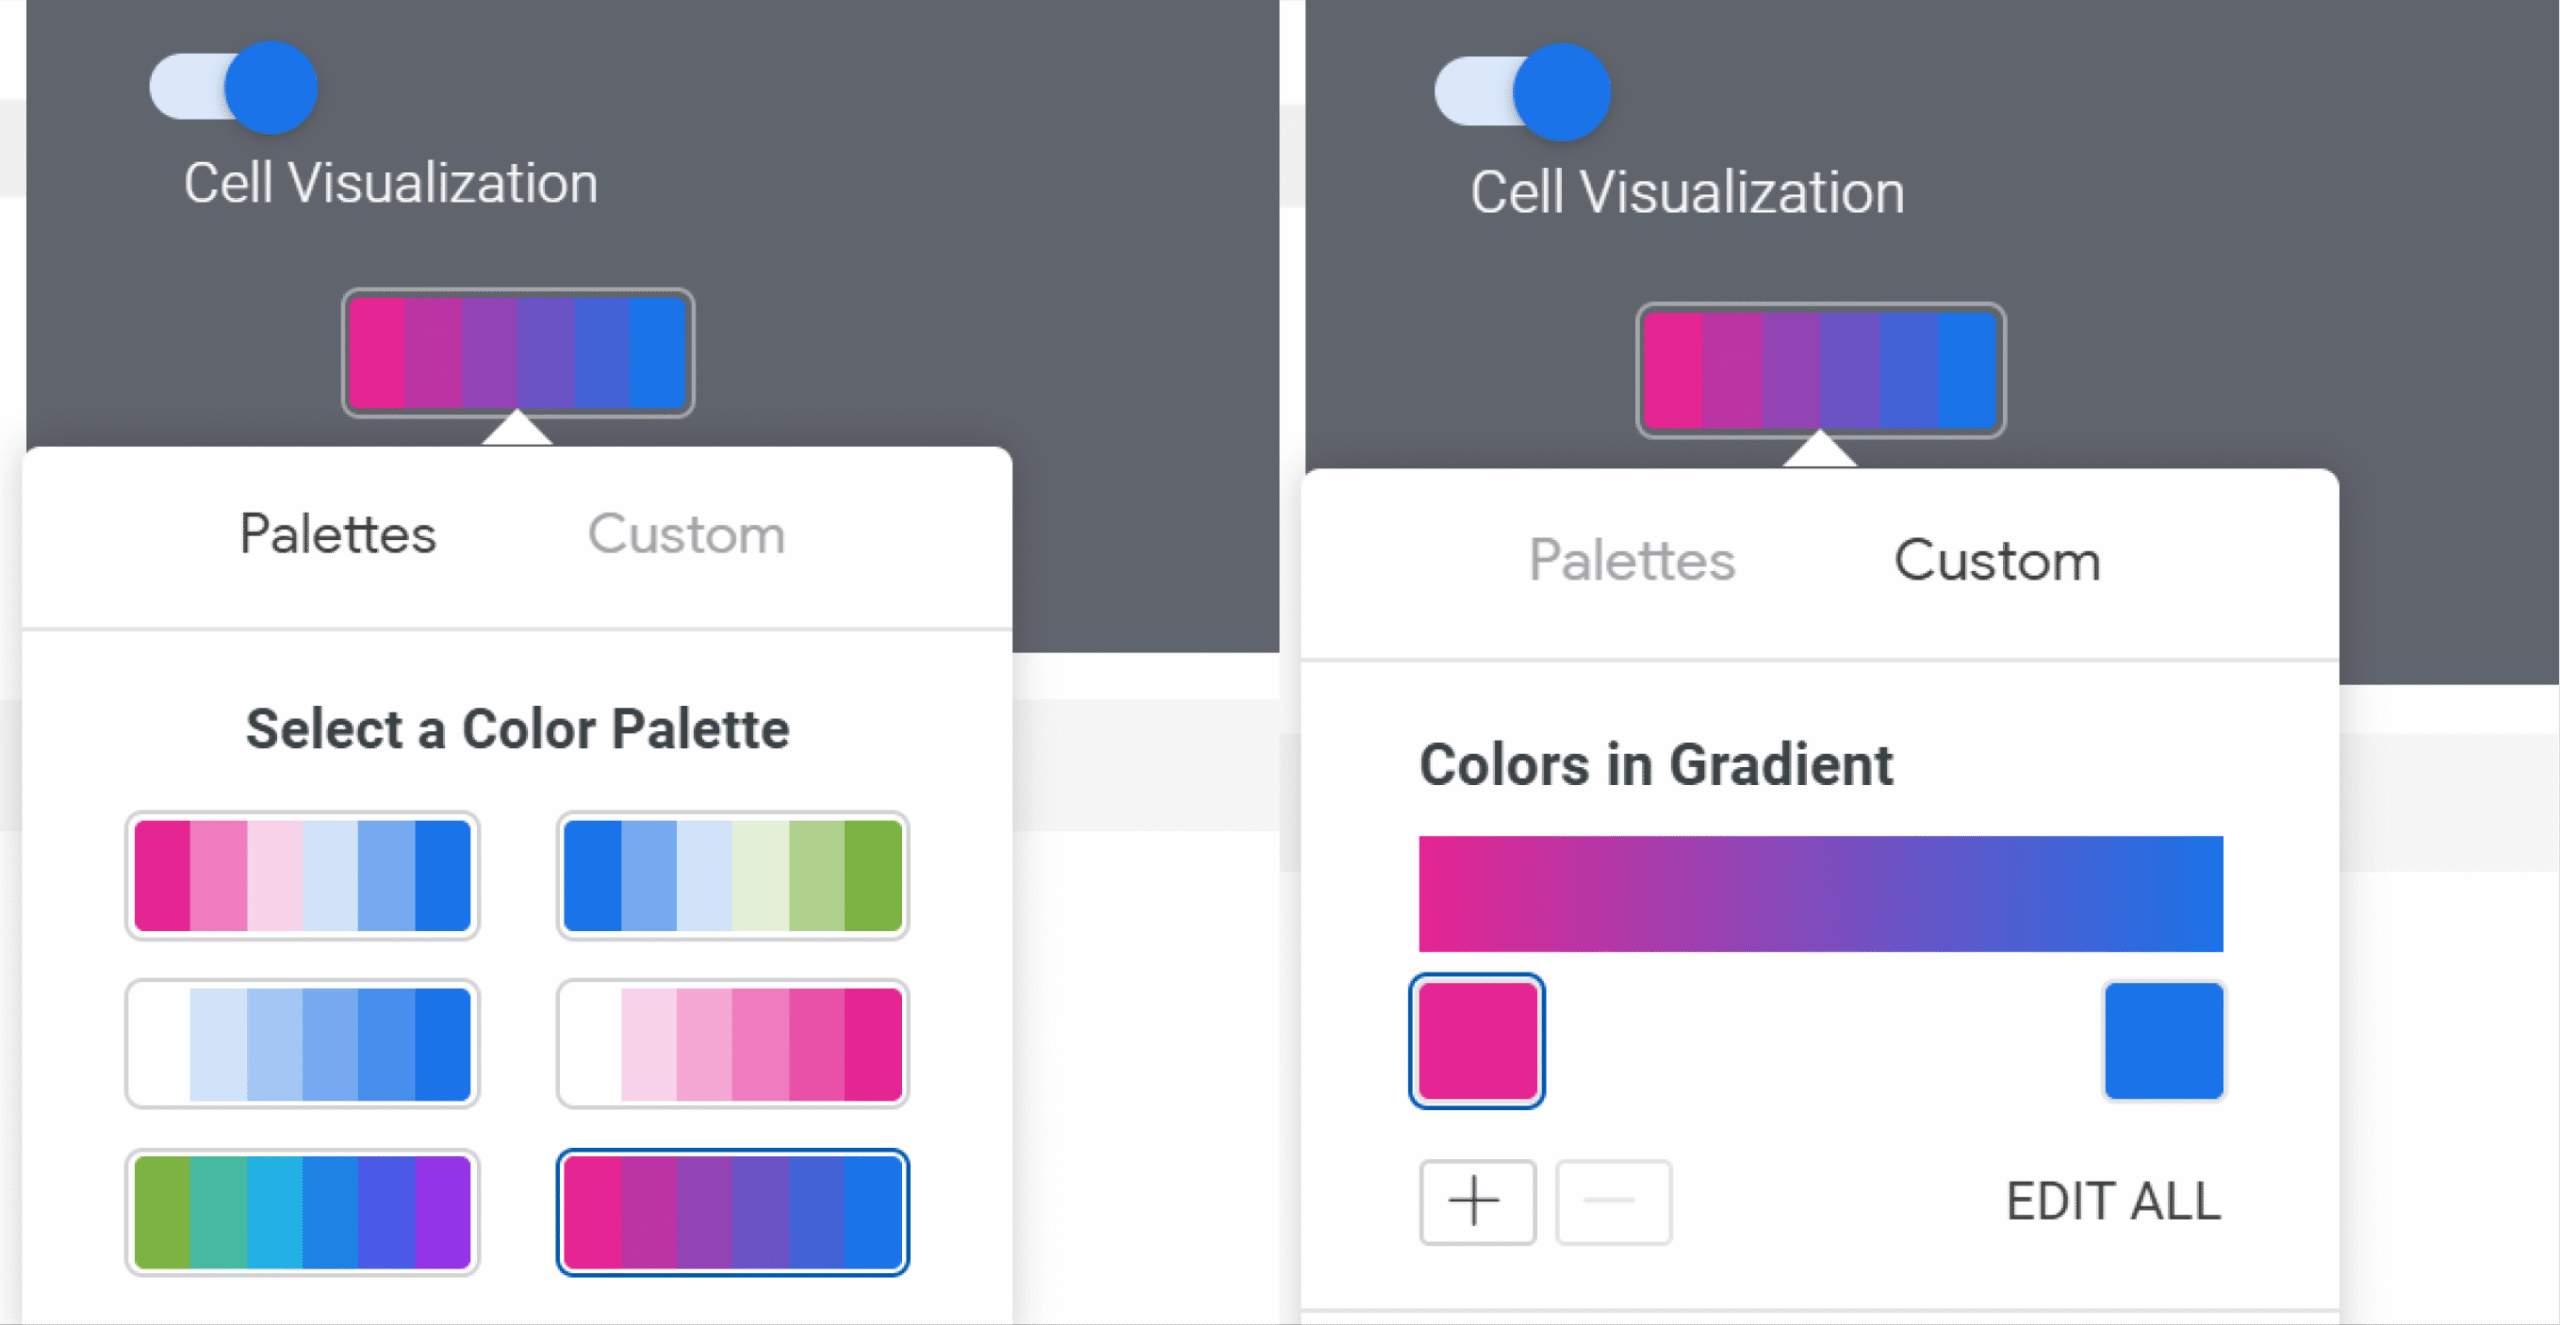
Google Looker: Colour formatting for Table Visualisations
In Looker, there are a few ways to use colour to make a Table visualisation easier to scan. In this blog, we’ll…
-

Dot vs. Bracket Notation
To read a piece of data inside D3, you look up it’s property name using either a dot (.) or square brackets…