Play With Size…
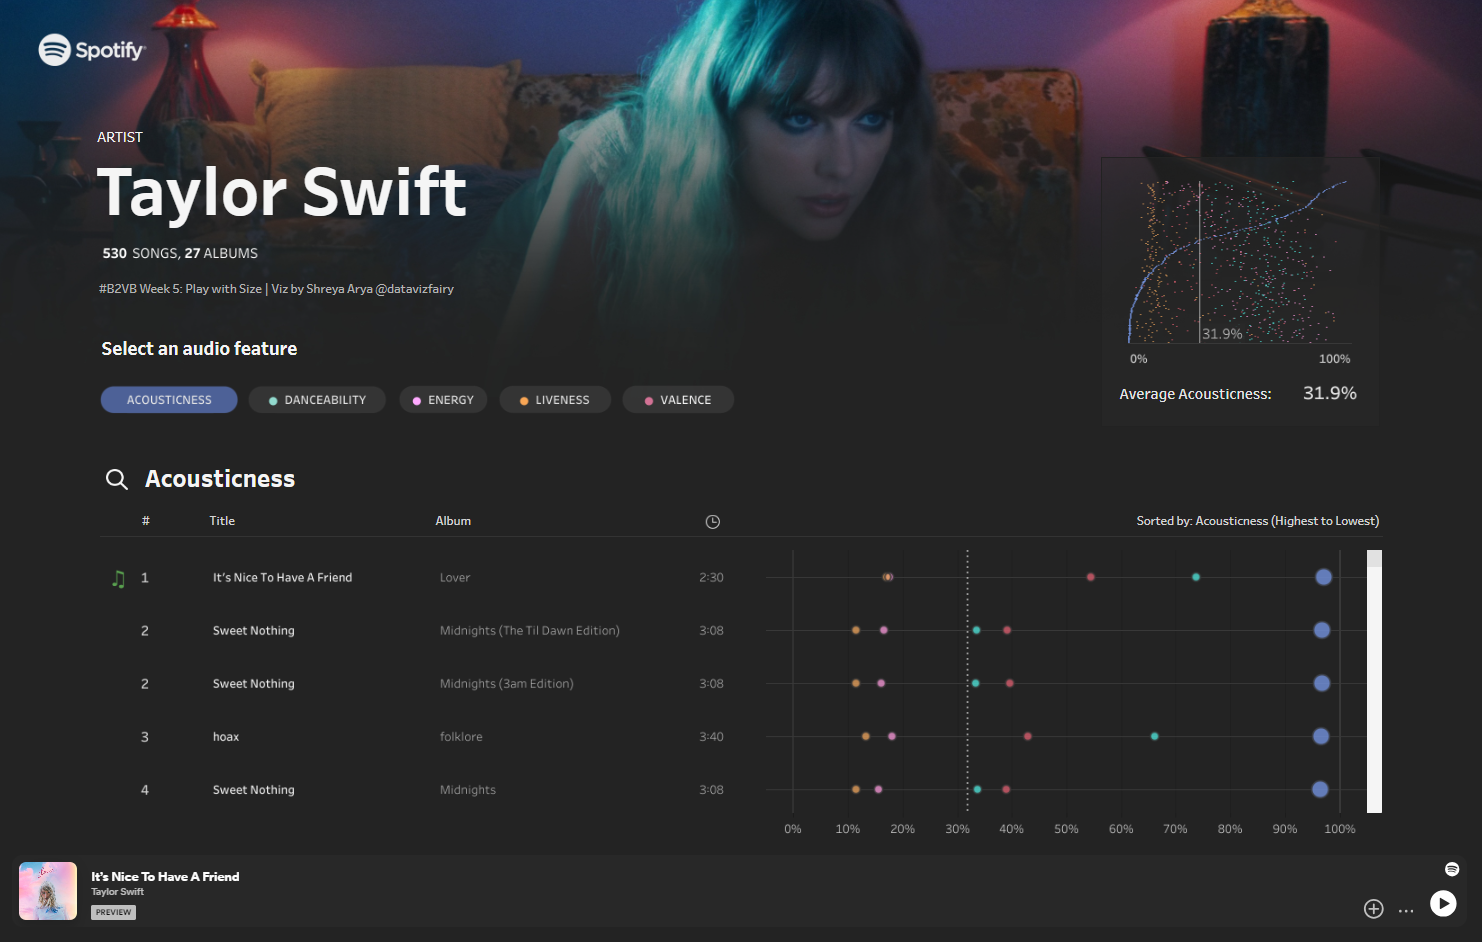
For this week’s Back 2 Viz Basics challenge: Play with size – we shared pre-pulled data from the Spotify API about Taylor Swift’s songs for you to experiment with 💚
This is a fun dataset to explore, containing information on audio feature ratings for each of her Spotify tracks, such as danceability, energy, acousticness…
Since we’re using Spotify data, I thought it would be fun to try and create a Spotify UI-like design in Tableau with it’s own embedded Spotify player, and I really like how it turned out! I parameterised it, so that the player updates according to the selected song. I think it adds a nice touch, and it’s very easy to do!
Here’s a quick, step-by-step guide on how to embed a Spotify player into your Tableau Dashboards 🎵✨
Here’s how…
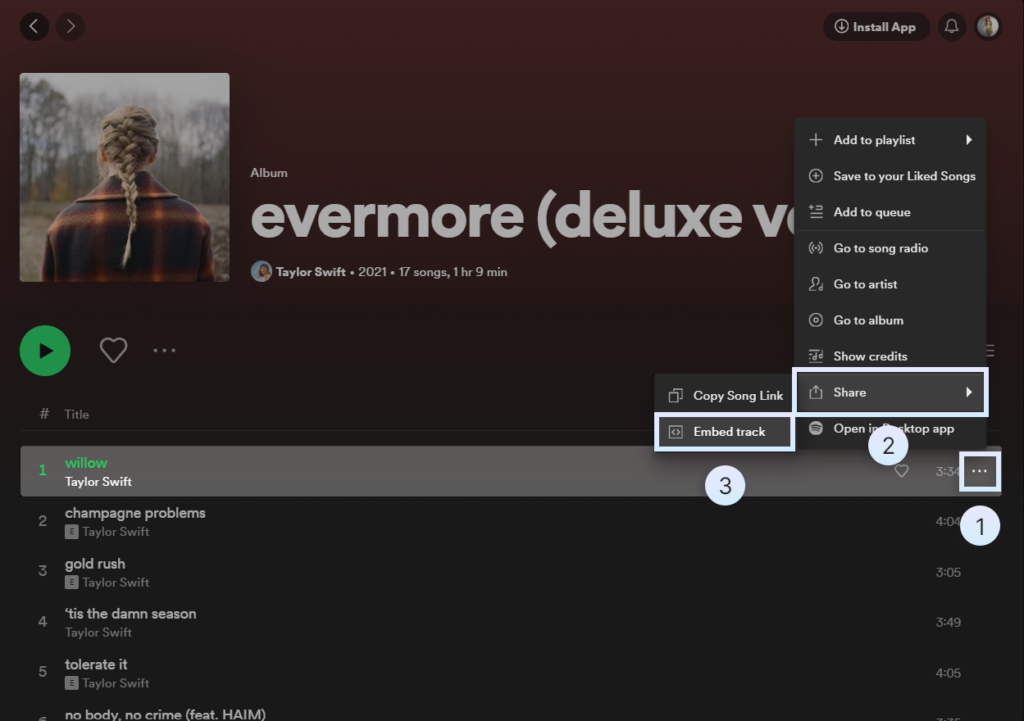
Step 1: Choose a song from Spotify
Head to open.spotify.com and select a song you’d like to embed into Tableau.
✨ You can also use Spotify Desktop, however I find it easier to use Spotify Web for this.
To go along with this weeks #B2VB theme, I’m going to pick the song willow by Taylor Swift.
Click on the three dots at the end of the track (…) > Share > Embed Track.
Step 2: Copy the URL link
Next, pick a colour for your embedded player (I want mine to be dark mode), and tick the option that says Show code.
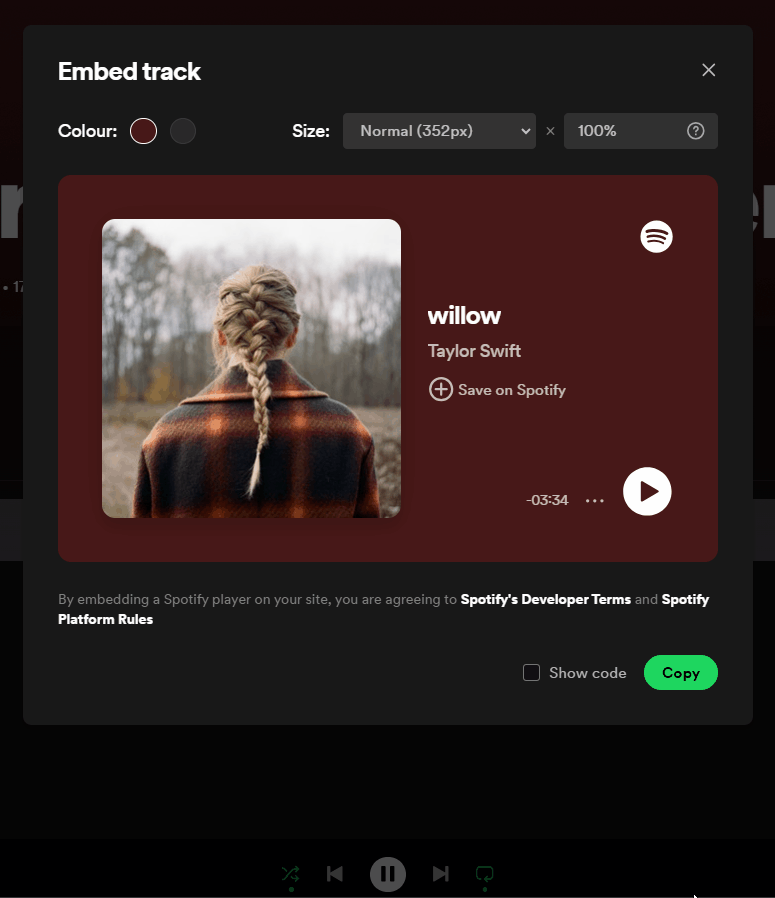
We want to copy a very specific part of the code, and that is the URL. This can be found between src=”[URL]“.
So for my example above, this would be the link highlighted in blue below.
<iframe style="border-radius:12px" src="https://open.spotify.com/embed/track/2gVhfX2Gy1T9kDuS9azrF7?utm_source=generator&theme=0" width="100%" height="352" frameBorder="0" allowfullscreen="" allow="autoplay; clipboard-write; encrypted-media; fullscreen; picture-in-picture" loading="lazy"></iframe>Step 3: Add a “Web Page” object to your dashboard
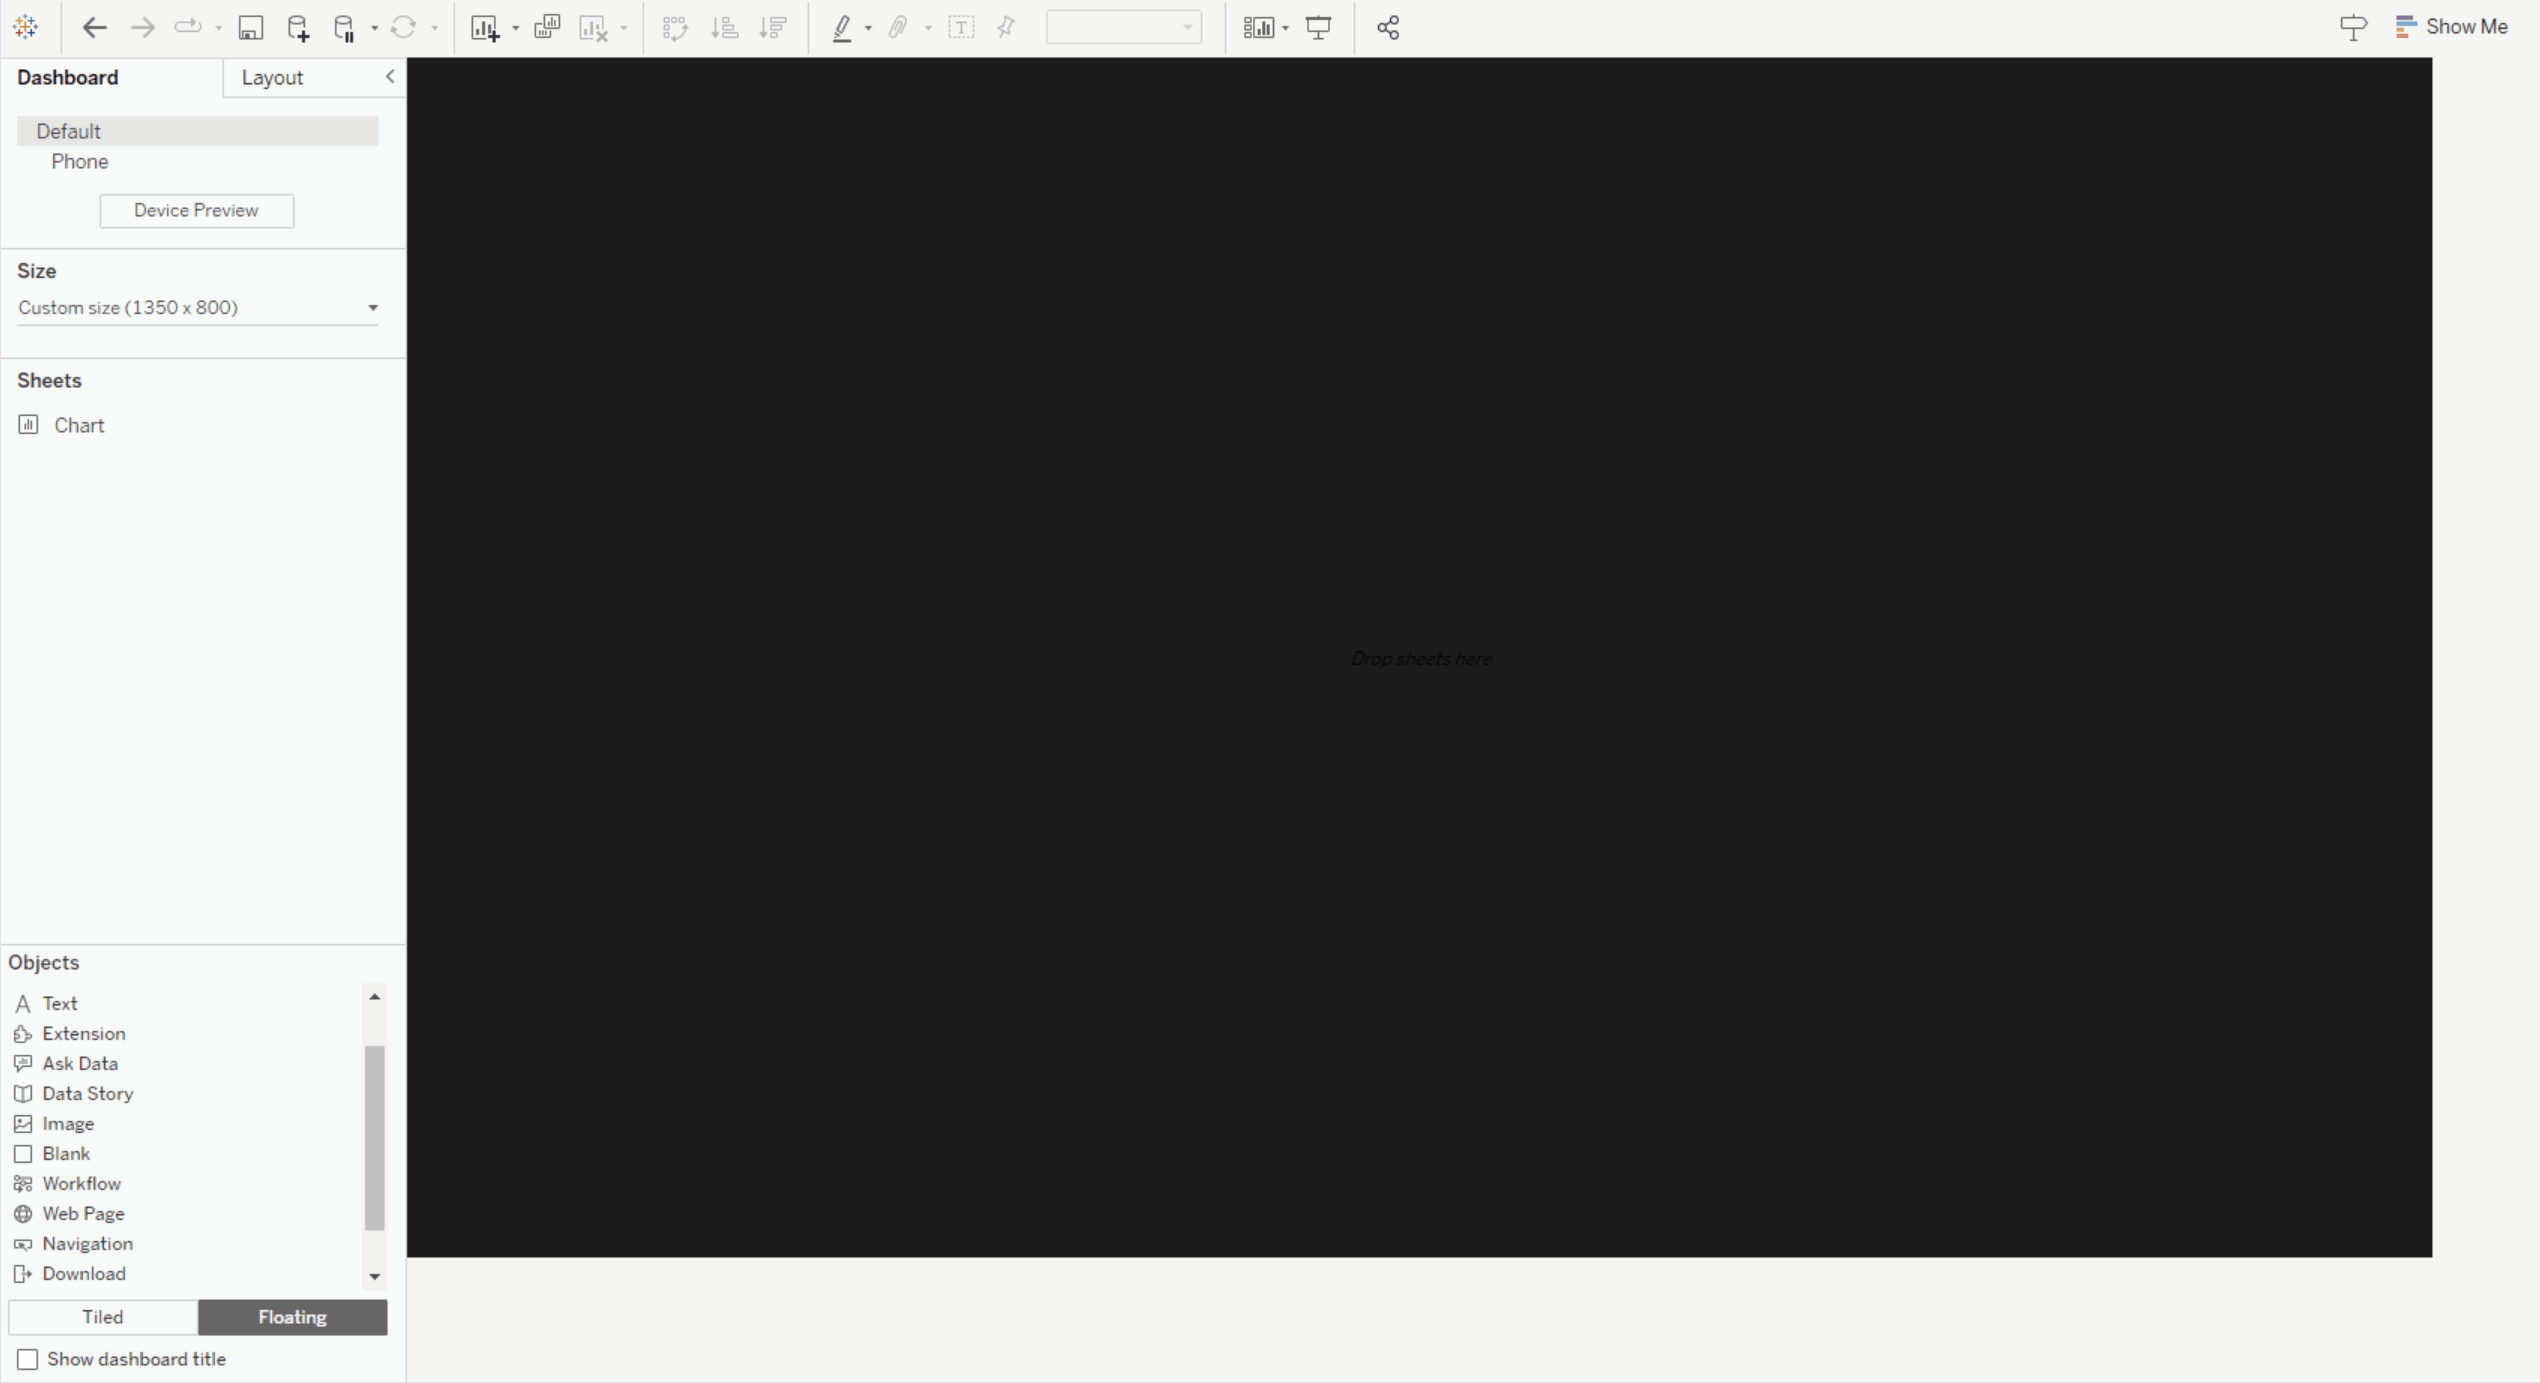
Open up Tableau Desktop and navigate to a dashboard.
On the left-side dashboard pane, under Objects, we have an object called Web Page.
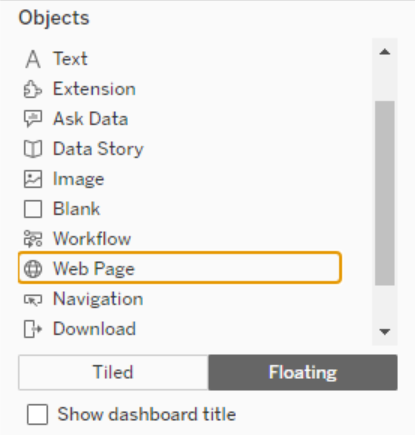
Bring this onto your Dashboard as a floating object for now.
This will prompt you for a URL. Enter the URL for your Spotify embedded track from Step 2.
Note: Don’t worry about the white background of the webpage – it won’t show up when you publish to Tableau Public / Tableau Server ✨
And with that, you’ve embedded a Spotfiy player into your Tableau Dashboard :)🎵
Parameterise your Player (optional)
If you’d like to take this one step further, you can also add a parameter to your web page object, so that the Spotify player updates according to the song selected!
The embedded Spotify URL contains the Spotify ID of the song selected, this is how it knows which song to play. So if we replace that part of the Web Page object with a parameter, we can make our player more dynamic!

Final Thoughts
Incorperating a Spotify Player into dashboards adds nice interactive touch, especially for music related vizzes! 🎵
If you’d like to practice with a Spotify-themed dataset, check out this week’s Back 2 Viz Basics: Play with Size! It’s quite a fun and large dataset, so you have plenty to explore from…
If you use this guide to embed a Spotify Player into your visualisation, I’d love to see what you’ve come up with! Feel free to tag me @datavizfairy on Twitter or Shreya Arya on LinkedIn ✨