What is a Custom Polygon Shape Graph?
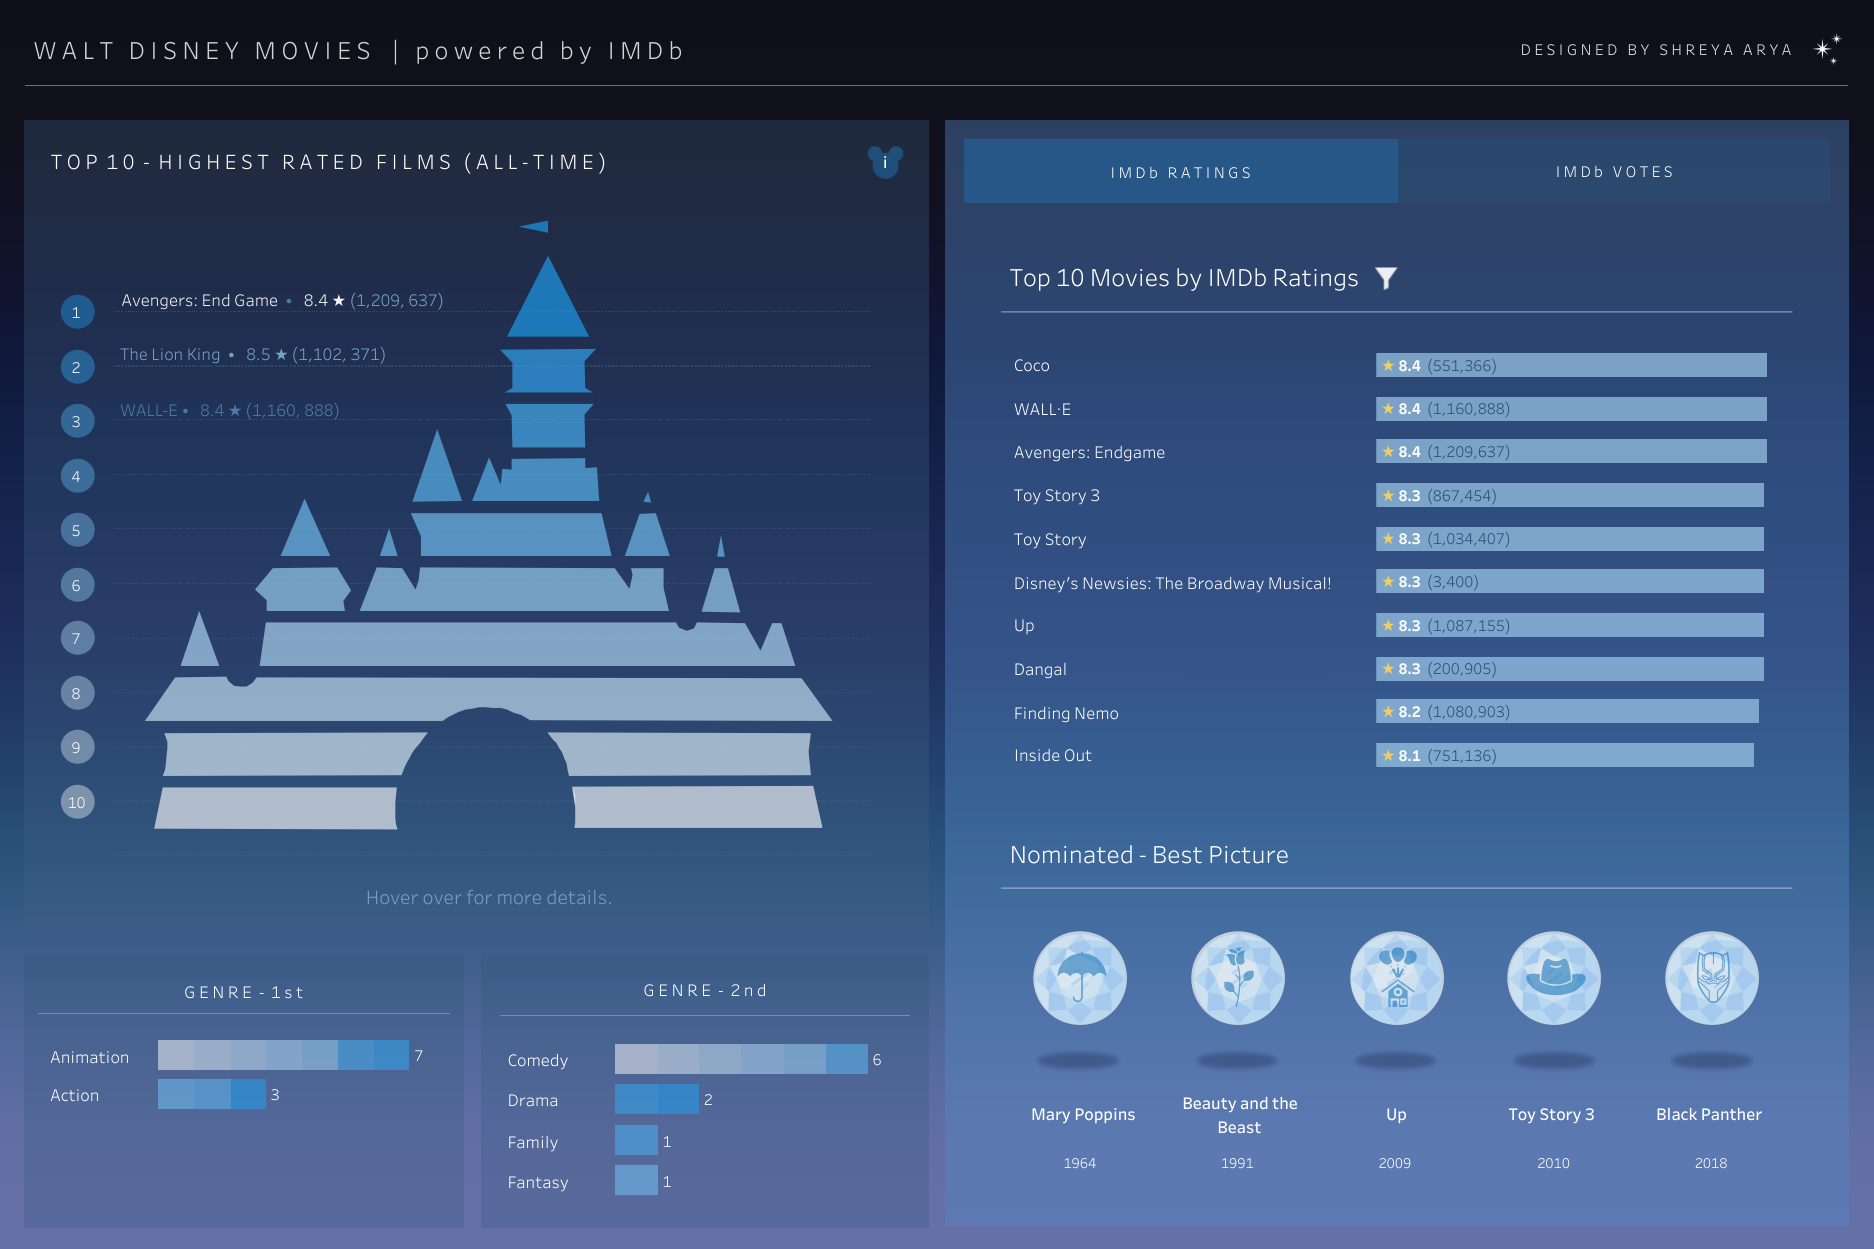
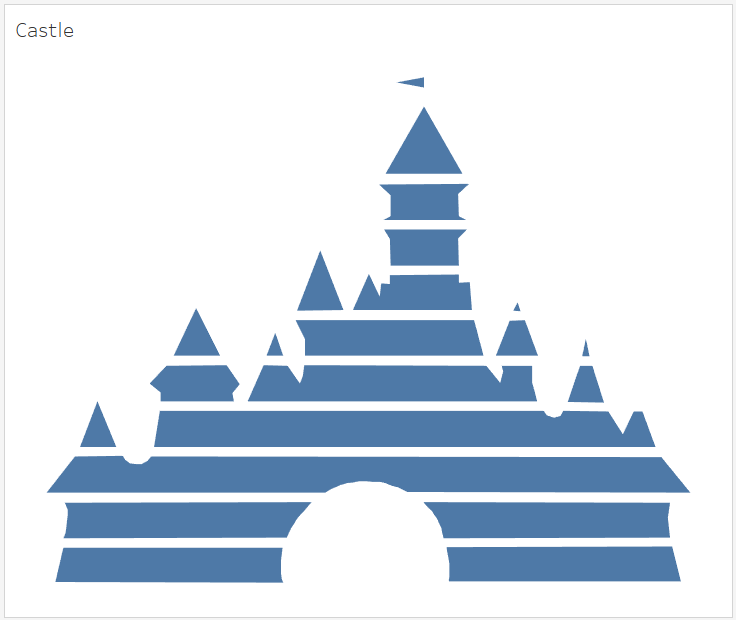
In my Walt Disney Movies #dataplusmovies dashboard, I incorperated the Disney Castle Logo into a Top 10 Ranking Graph, by creating a custom polygon shape graph.
By plotting coordinates for each of my polygon shapes, and changing the Marks type for this graph to “Polygon”, I was able to create this cool, functional Disney Castle graph. And with the help of an amazing tool, this type of graph is actually pretty easy to create! ✨

Here’s an easy to follow, step-by-step guide on how you can create these custom polygon shapes in Tableau using an existing image for reference.
Before I head into the tutorial, I just wanted to give a quick shout-out to Zdravka Bratuhcheva for helping me find the CBI Studio by Interworks website! Definitely check out her Socials to see what she’s creating!

Zdravka Bratuhcheva
Tableau / Alteryx Consultant • The Information Lab


Here’s how…
Step 1: Select an image
First decide on the image or shape you would like to have as a Polygon.
✨ You can select any image / image type for this step
For my Walt Disney Movies dashboard, I wanted the logo to be split into 10 equal sections so I could assign each section with a ranking 1-10. Therefore I prepared an image of this first.

Step 2: Import your image into CBI Studio by Interworks
Head to the CBI Studio by Interworks site.
From the starting page, select the option that says “I have an image I’d like to create data points from”.

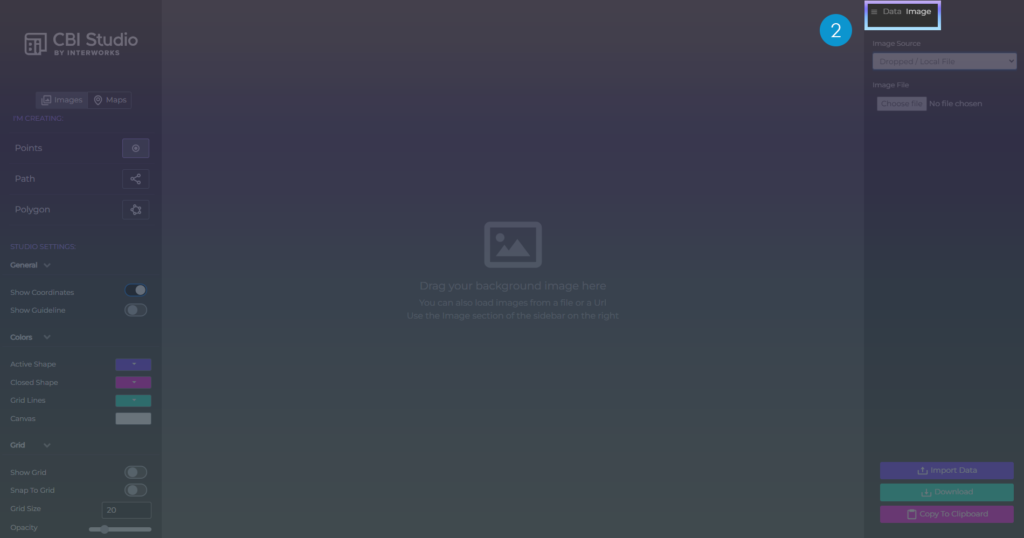
To add in our image, at the top of the right-hand pane, switch the view from Data to Image.
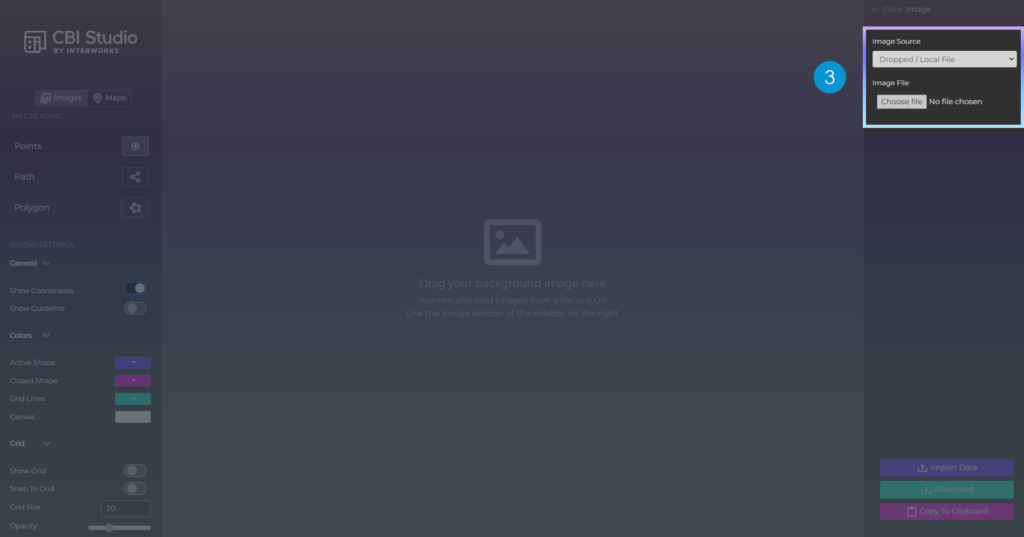
If you want to add an image from a URL Link, change “Image Source” to “Url” using the drop-down menu and type in the URL link in the box below.
Otherwise, if you’d like to upload an image from your local files, you can select Choose file.
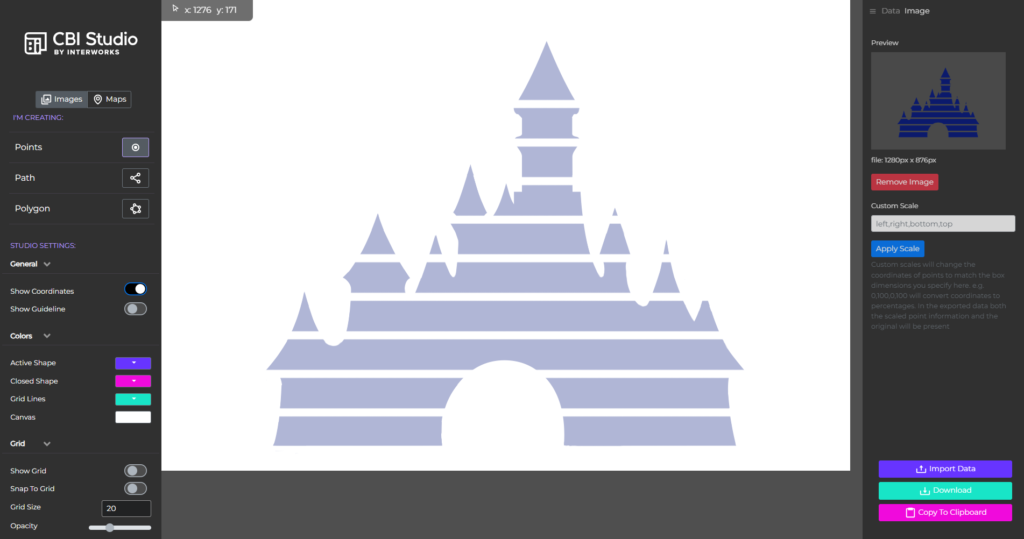
Once you’ve imported your image into CBI studio, you should see it appear onto the main view ⭐
Step 3: Plot your polygon!
Now, we can begin plotting our polygon!
On the left-side panel, under I’M CREATING, select the Polygon option.
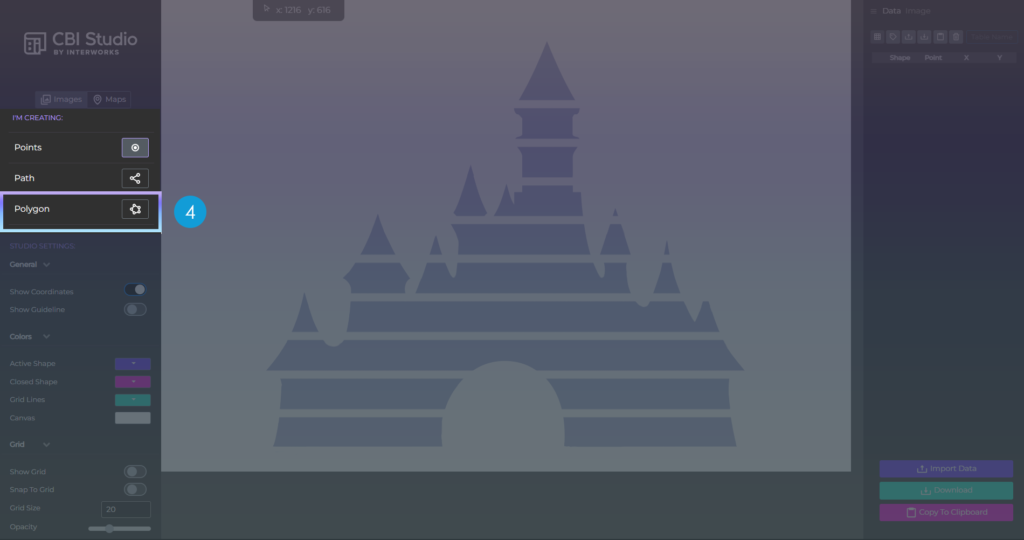
Start plotting your polygon by clicking around the outline of your shape.
If you switch the right-hand panel view from Image back to Data, you’ll notice that by placing these points, the CBI Studio tool is creating a dataset for you!
✨ To close / complete your polygon, click back onto your starting point.
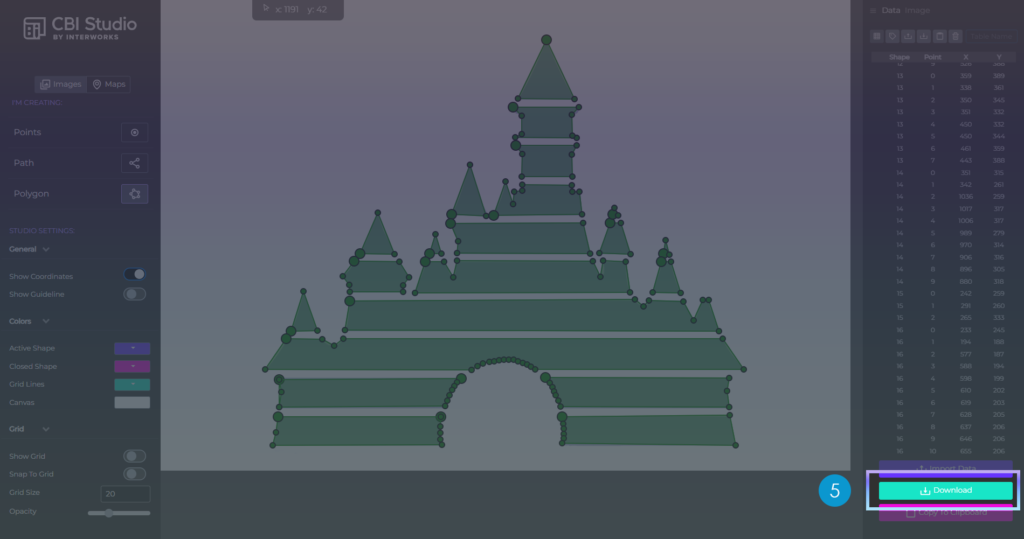
Step 4: Export your data points (.csv)
Once your happy with your polygon(s), click on the Download option at the bottom of the data pane on the right.
This will allow you to download the data for your polygon as a .csv file.
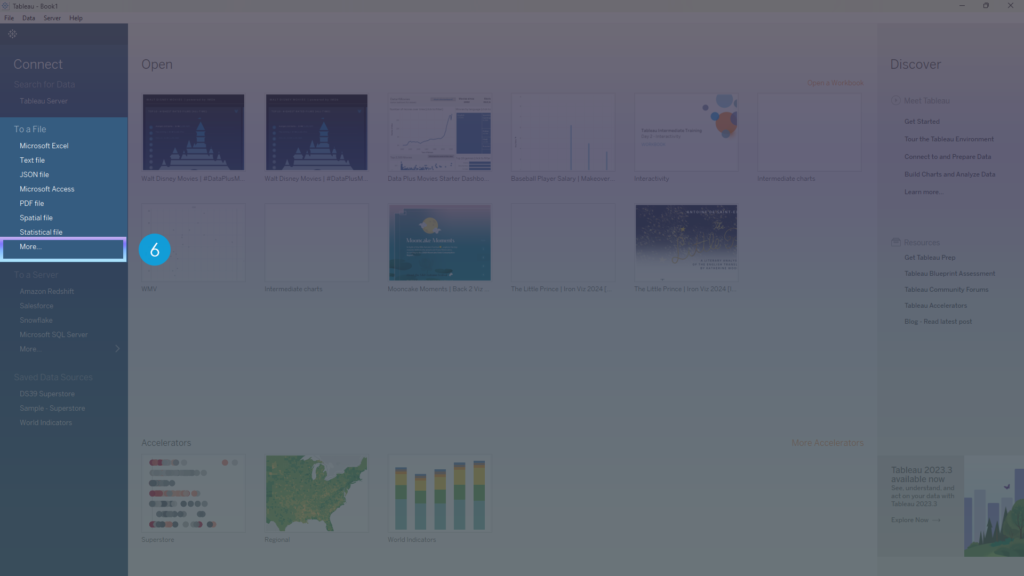
Step 5: Load your polygon file into Tableau Desktop
Open up a new instance of Tableau Desktop.
On the left-side of the Connection Pane, under “To a File”, select the More option.
Locate the polygon .csv file you downloaded earlier, and bring that data into Tableau.
Step 6: Build your Polygon Shape Graph
Navigate to a new worksheet.
Place the field Point X onto Columns. Right-click on the pill and set this as a DIMENSION.
Place the field Point Y onto Rows. Right-click on the pill and set this as a DIMENSION.
Change the Marks type to Polygon in the Marks Card.
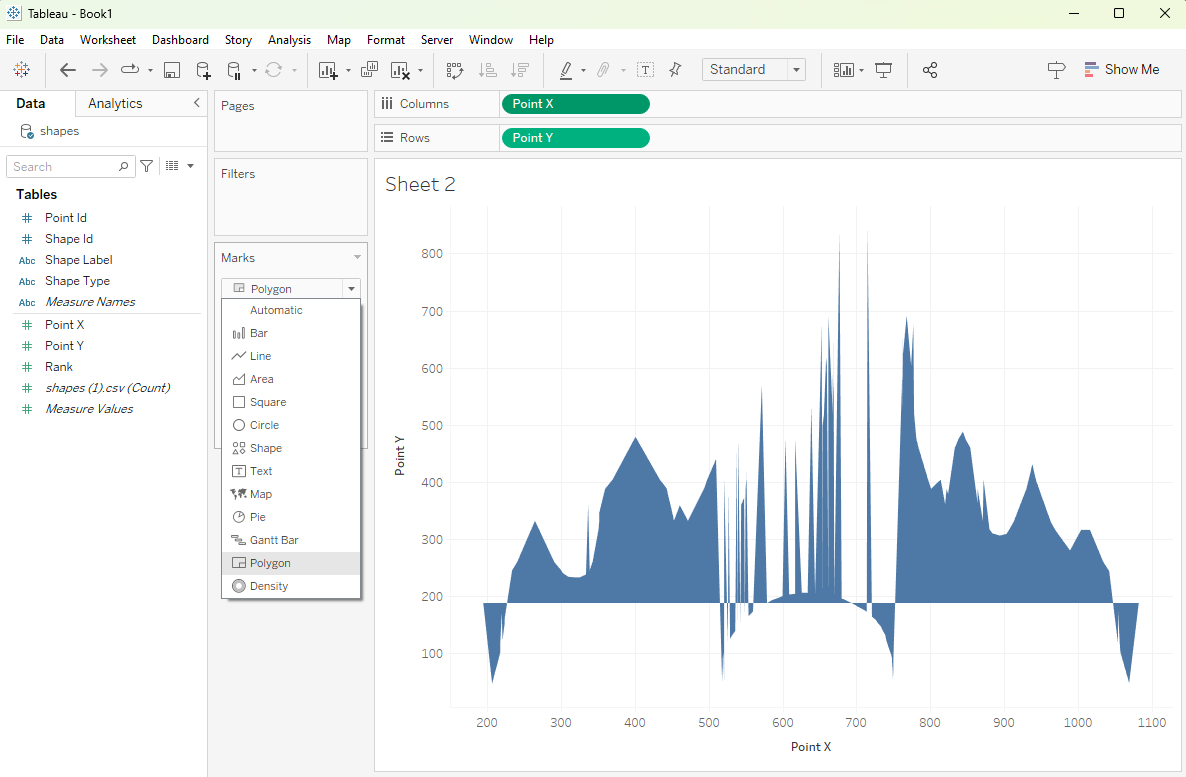
Finally, drag:
1) Shape Id onto the Detail card
2) Point Id onto Path.
Now all that’s left to do is hide the axis and remove the gridlines. And voila! You’ve created your own custom shape polygon graph ✨
Final Thoughts + Combining this with other data
Hopefully you found this guide easy-to-follow along with!
It think it’s a really cool way to incoperate more imagery into your data visualisations, and if you combine this technique with some additional data, you can make the polygon graph more functional also.
In order to link this chart with the Top 10 Disney Movies (All-time) data, I used Tableau Prep to create an inner join between my polygon.csv file and the Top 10 IMDb data, and then brought this into Tableau and created my Castle Polygon Graph.
If you use this guide to create your own Custom Polygon Graph, I’d love to see what you’ve come up with! Feel free to tag me @datavizfairy on Twitter or Shreya Arya on LinkedIn ✨