Happy little trees… 🌳
I love Bob Ross – he’s always been such an inspiration to me. So when Coach Robbin set this past Makeover Monday challenge for one of the Data School cohorts in training, I couldn’t help but want to give it a go as well.
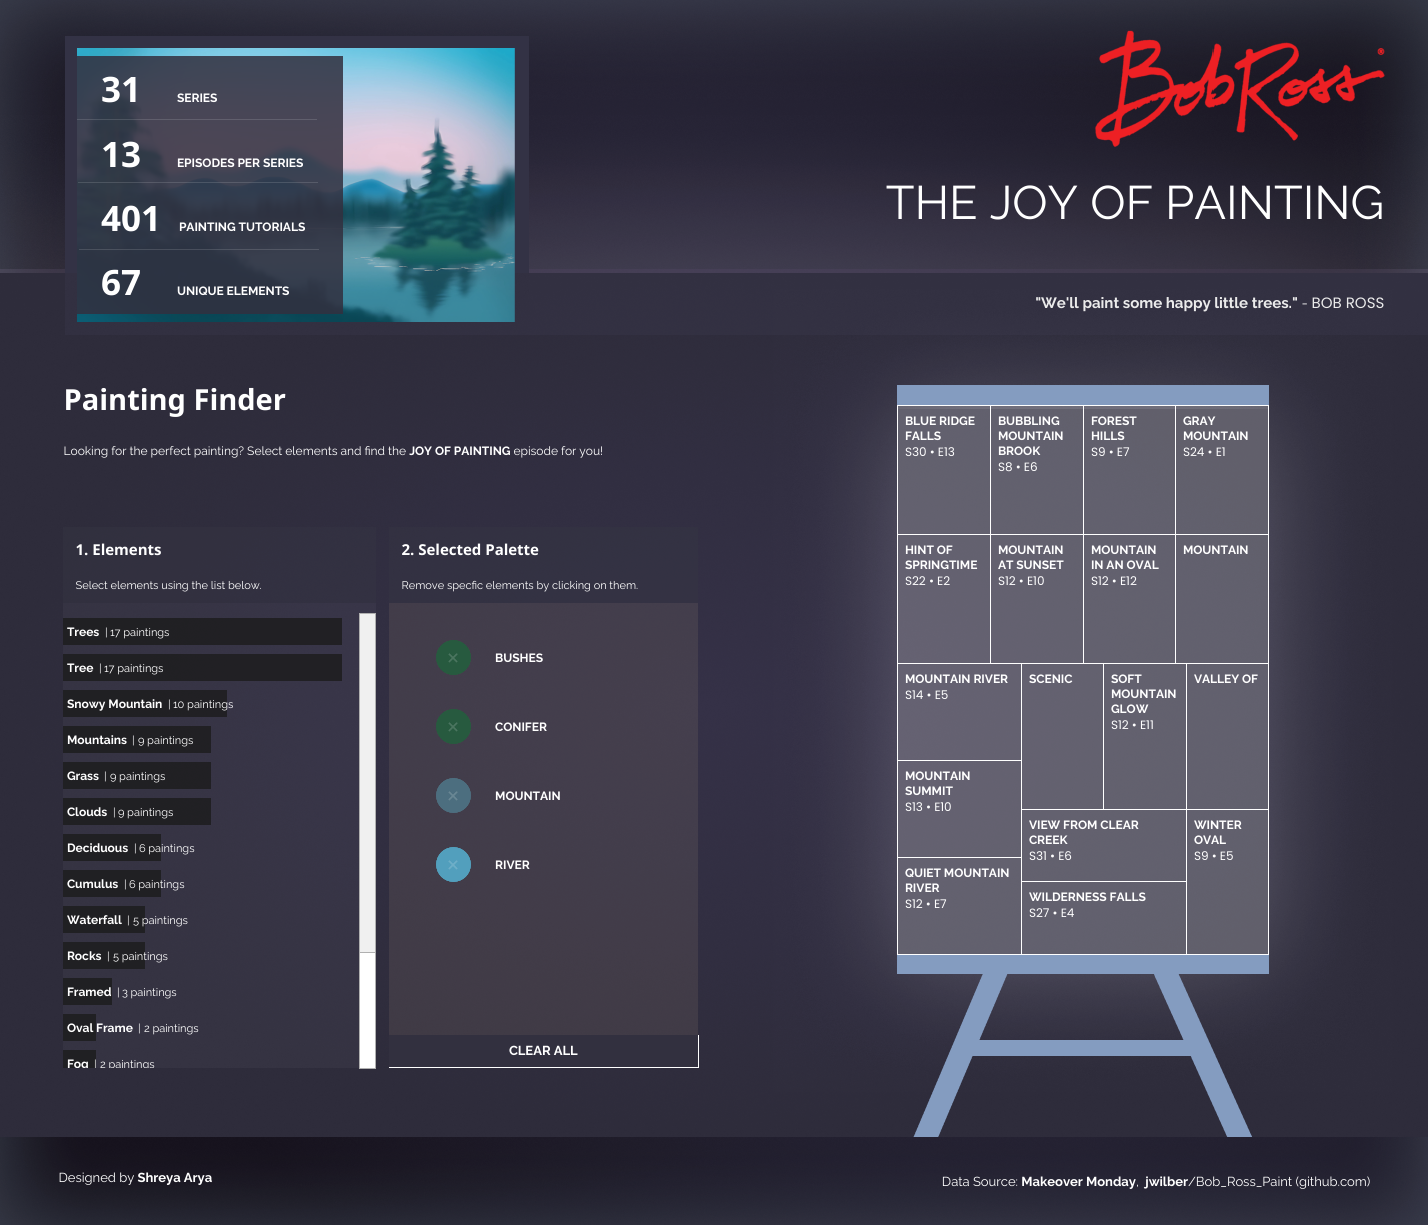
After coming across this dataset, I wanted to figure out a way for users to pick some element tags and filter down to find their perfect painting tutorial.
They could then find the episode and season it’s from, and have a little painting fun while they’re at it! 🎨

View ‘Bob Ross Painting Finder’ via Tableau Public
About the dataset
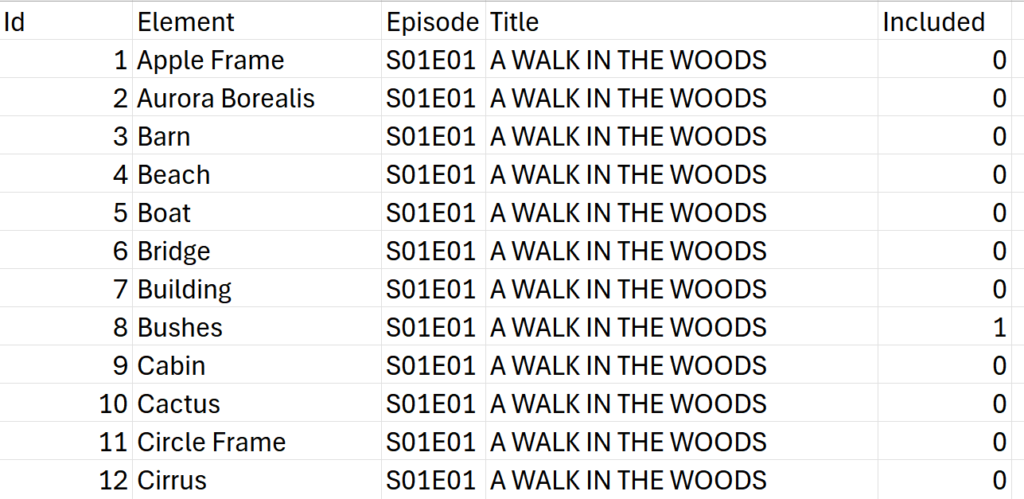
The dataset has the following structure. For every Title painted, there’s a row for each element, and you can see which elements or tags were actually included in the painting using the ‘Included’ flag. Each episode of The Joy of Painting by Bob Ross focuses on a new painting tutorial, also known as the Title.
In the snippet below, for episode S01E01 – A WALK IN THE WOODS, you can see that only Bushes were included in the painting (with a 1 under ‘Included’), while all other elements were not.
The Logic!
To let the user select multiple elements from a list, I’ll be creating a Set. The idea is to use this Set to figure out which elements co-occurr across different paintings.
We’ll do this by counting how many of the selected elements appear in each painting. But before diving into the calculations, here’s a simple example to show what that looks like.
Example
Each Title (or Painting) has a list of elements that are included, depending on what’s featured in the artwork. For example:
| Title | Elements Included |
|---|---|
| Painting Name 1 | Clouds, Flower, Mountain |
| Painting Name 2 | Clouds, Bushes |
| Painting Name 3 | Flower, Trees, Lake |
Now, say the user selects two elements in the Set (let’s say Clouds and Flower). We want to know how many of those selected elements appear in each painting.
- Painting 1 includes both → returns 2
- Painting 2 includes one → returns 1
- Painting 3 includes one → returns 1
We then create a calculation that compares:
Selected Elements per Painting vs Total Elements Selected
From here, we can add a filter. Remember, in our dataset, each element has its own row. So we can create a boolean by checking:
Selected items = Total elements in painting
This lets us filter our elements list down to just those that are fully co-occurring across paintings based on the user’s selection.
Step by Step & Calculations
Now that you’re hopefully feeling a bit more confident with the logic, I’ll go through how I set up the Co-occurrance Filter step-by-step. You can follow along by downloading the Bob Ross Makeover Monday Dataset.
Here’s how…
Step 1: Create a Set
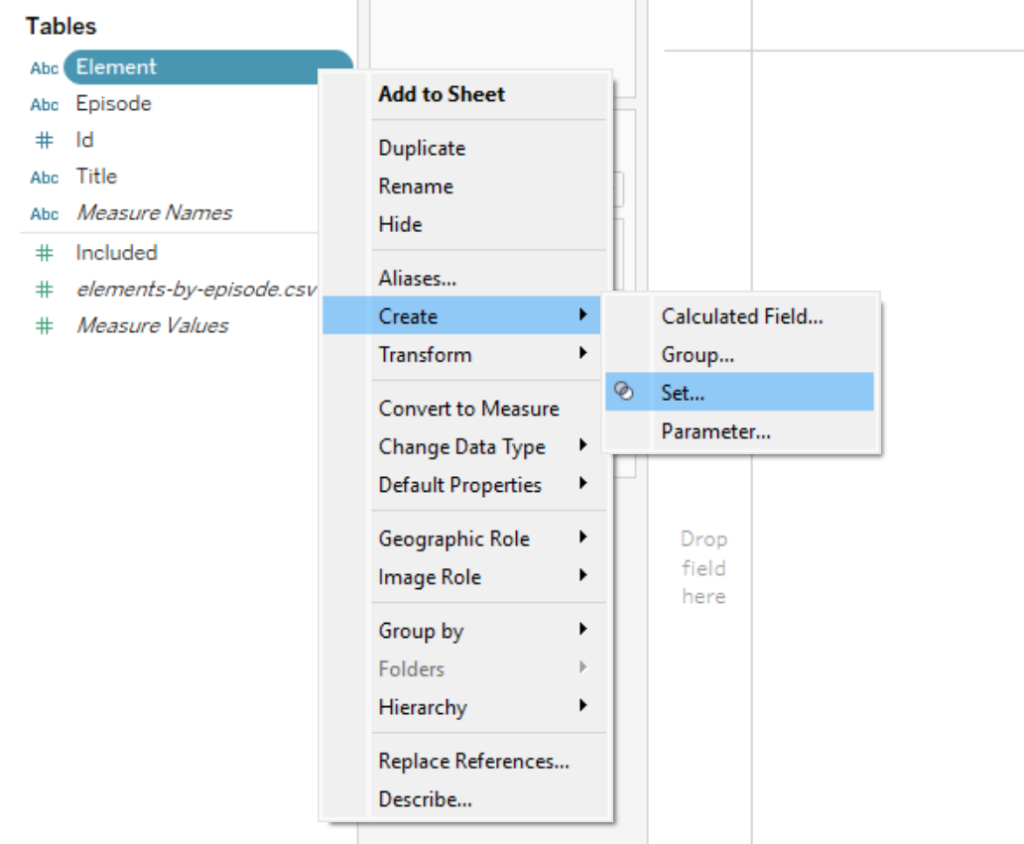
Let’s start by creating a Set on the [Elements] field.
Right-click on the Elements field in the data pane > Create > Set…
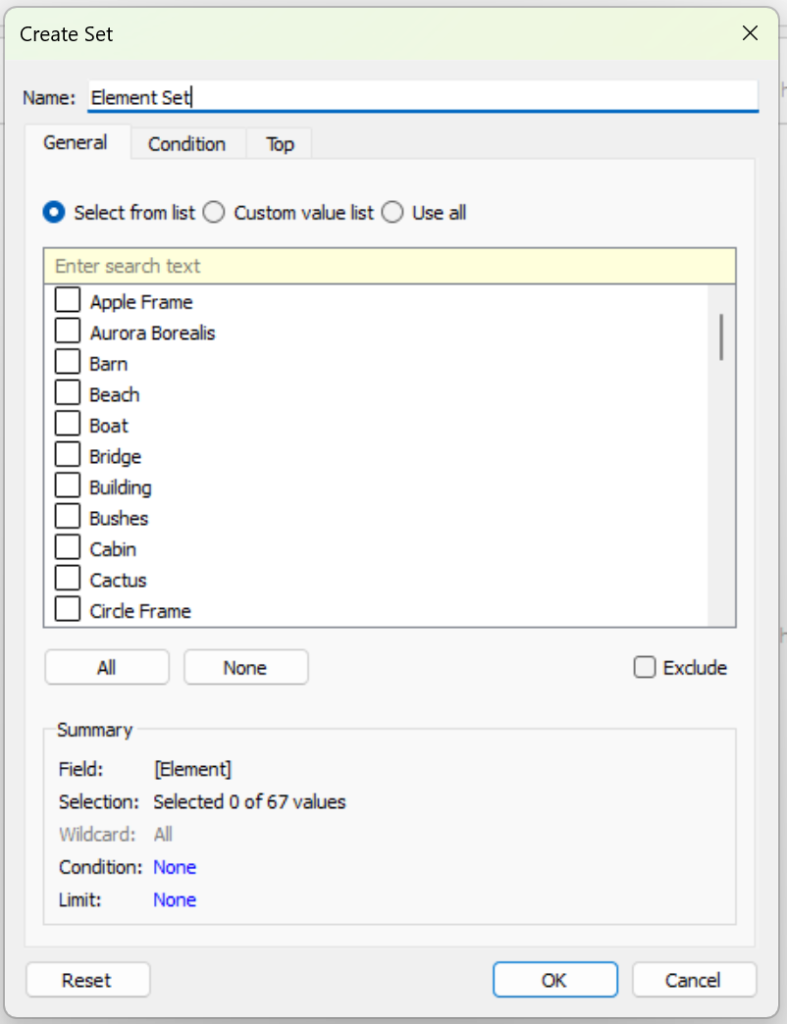
I’m going to keep the default name ‘Element Set‘ and hit OK.
💡 Sets let you select multiple items, and can be used in calculations based on whether the items are IN or OUT of the set.
Step 2: Create your Co-occurrance Calculations
Now let’s create the calculations for the co-occurrance logic. You can copy and paste them from below!
1. Selected Elements in Title
For each painting title, we want to count the elements that:
- are selected in the Element Set
- and have an Included flag of 1 (i.e. actually appeared in the painting)
//1. Selected Elements in Title

{ FIXED [Title] :
  COUNTD(
    IF [Element Set] AND [Included] = 1
    THEN [Element]
    END
  )
}
2. Total Selected Elements
Here we’re counting how many elements have been selected overall from the Element Set.
//2. Total Selected Elements

{ FIXED :
  COUNTD(
    IF [Element Set]
    THEN [Element]
    END
  )
}
Now for an Title – if the first calculation returns the same number as this one, we know the painting includes all the selected elements.
3. Valid Titles
Check if the values are the same. This creates a Boolean.
//3. Valid Titles

[1. Selected Elements in Title] = [2. Total Selected Elements]
And finally, since we’re looking to filter a list of elements, not Titles, we’re going to create a more focused filter calculation next.
4. Co-occurring Elements Filter
If the elements are included in the same episode or painting together – it will return True.
//4. Co-occurring Elements Filter

[Included] = 1 AND [3. Valid Titles]
Step 3: Build your Charts
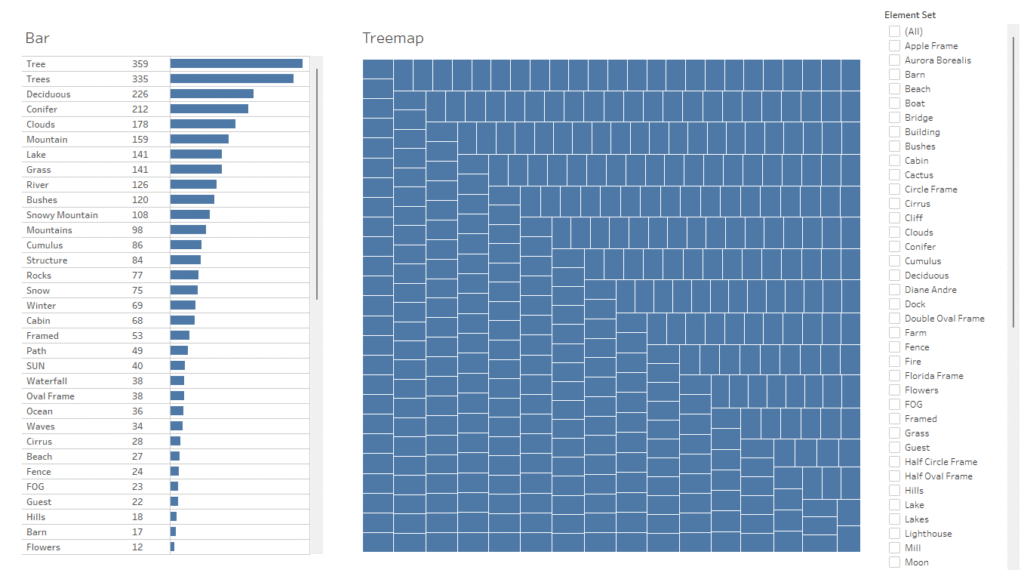
Now let’s build our two main visuals – the Bar Chart and the Treemap. You can style these however you like! The main thing is that we’re setting them up for interactivity.
Bar Chart
The Bar Chart shows how many paintings each element appears in.
1. Drag [Element] and [Element Set] onto Rows. Add COUNTD([Title]) to Columns.
2. Place [4. Co-occurring Elements Filters] onto the Filters card and set it to True.
3. Sort the bars in descending order.
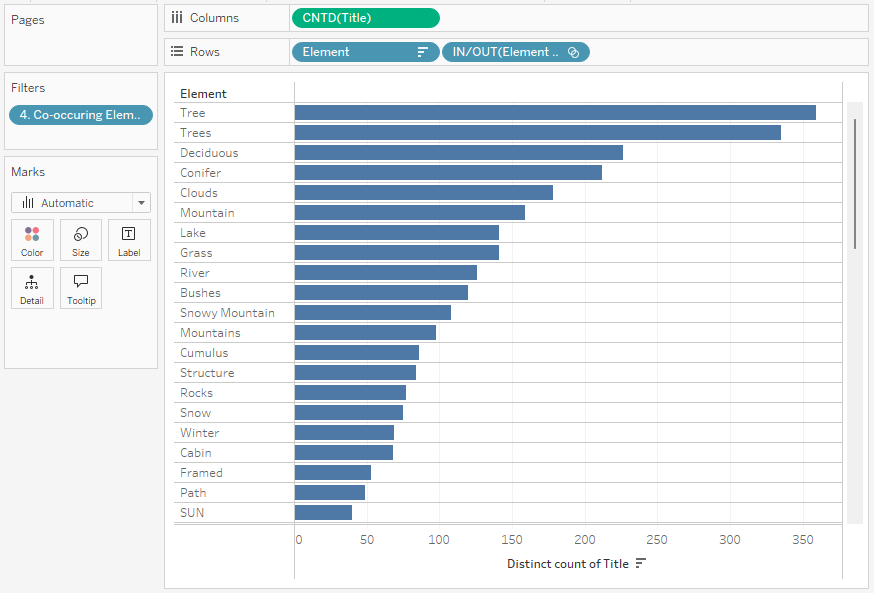
3. Hide the [Element Set] header – it’ll still be there, just not showing on the visual.
4. Show the [Element Set] card by right-clicking the pill and choosing ‘Show Set’. Then select some tags from the dropdown.
Now you can see the Co-occurrance filter in action!
5. (Optional) To remove pre-selected elements from the list, I duplicated the [IN/OUT(Element Set)] pill to the Filters shelf and set it to Out.
Format and style the bar chart as desired.
Treemap
The Treemap shows how many Paintings contain the co-occurring elements.
1. Place [Title] onto Detail on the Marks Card.
2. Place CNTD(Title) onto Size.
3. Place [4. Co-occurring Elements Filters] onto the Filters card and select True.
Now both charts respond to the [Element Set] Selection!
Once again, feel free to style this Treemap as desired.
Step 4: Set Actions!
On a fresh dashboard canvas, drag both of these sheets onto the same view.
We’re going to set up a Set Action, so the user can interact directly with the Bar Chart to select elements, and the Treemap will show which paintings those co-occur in.
1. From the Top toolbar: Dashboard > Actions…
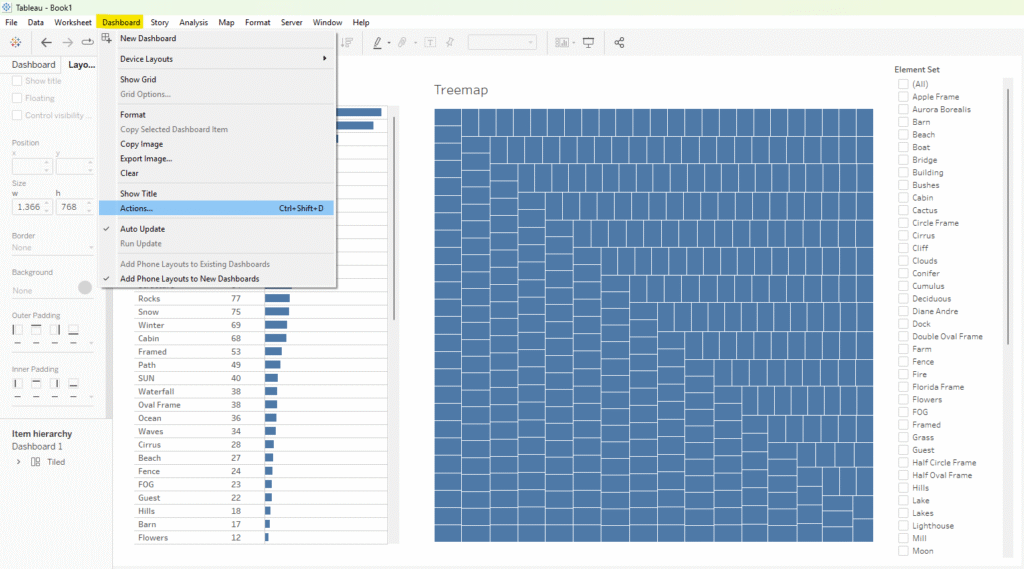
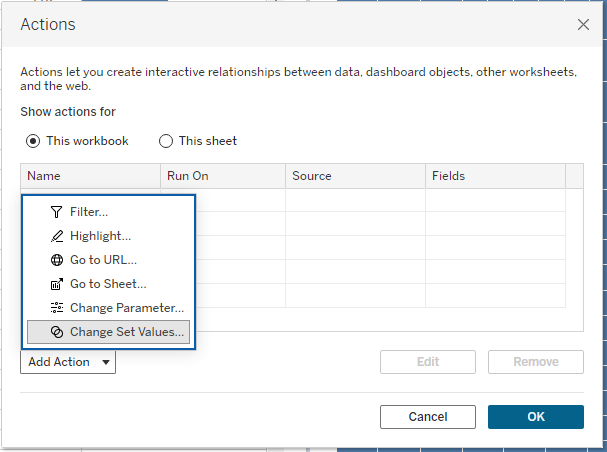
2. From the Actions Configuration menu, click ‘Add Action’ and choose ‘Change Set Values’.
Configure the Set Action as shown below. I’ve named it “Select Elements – Bar”.
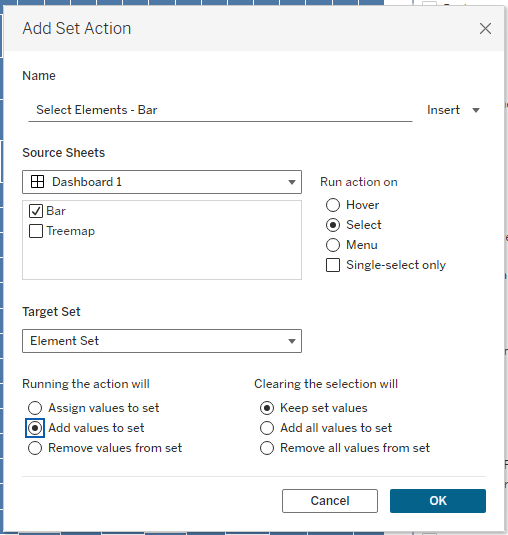
3. Press OK. Now the user can select elements directly from the bar.
In a similar way, you can also create a Reset button by using a worksheet and setting up a Set Action to remove all values from the set.
Final Thoughts 🌳
Hopefully you’re now feeling more confident with how the co-occurrence logic works. I think this approach could have some really fun and useful applications in everyday dashboarding and reporting.
If you found this blog on co-occurrence filters helpful and come up with other fun use cases, I’d love to see what you’ve built! Feel free to tag me @datavizfairy on Twitter or Shreya Arya on LinkedIn ✨