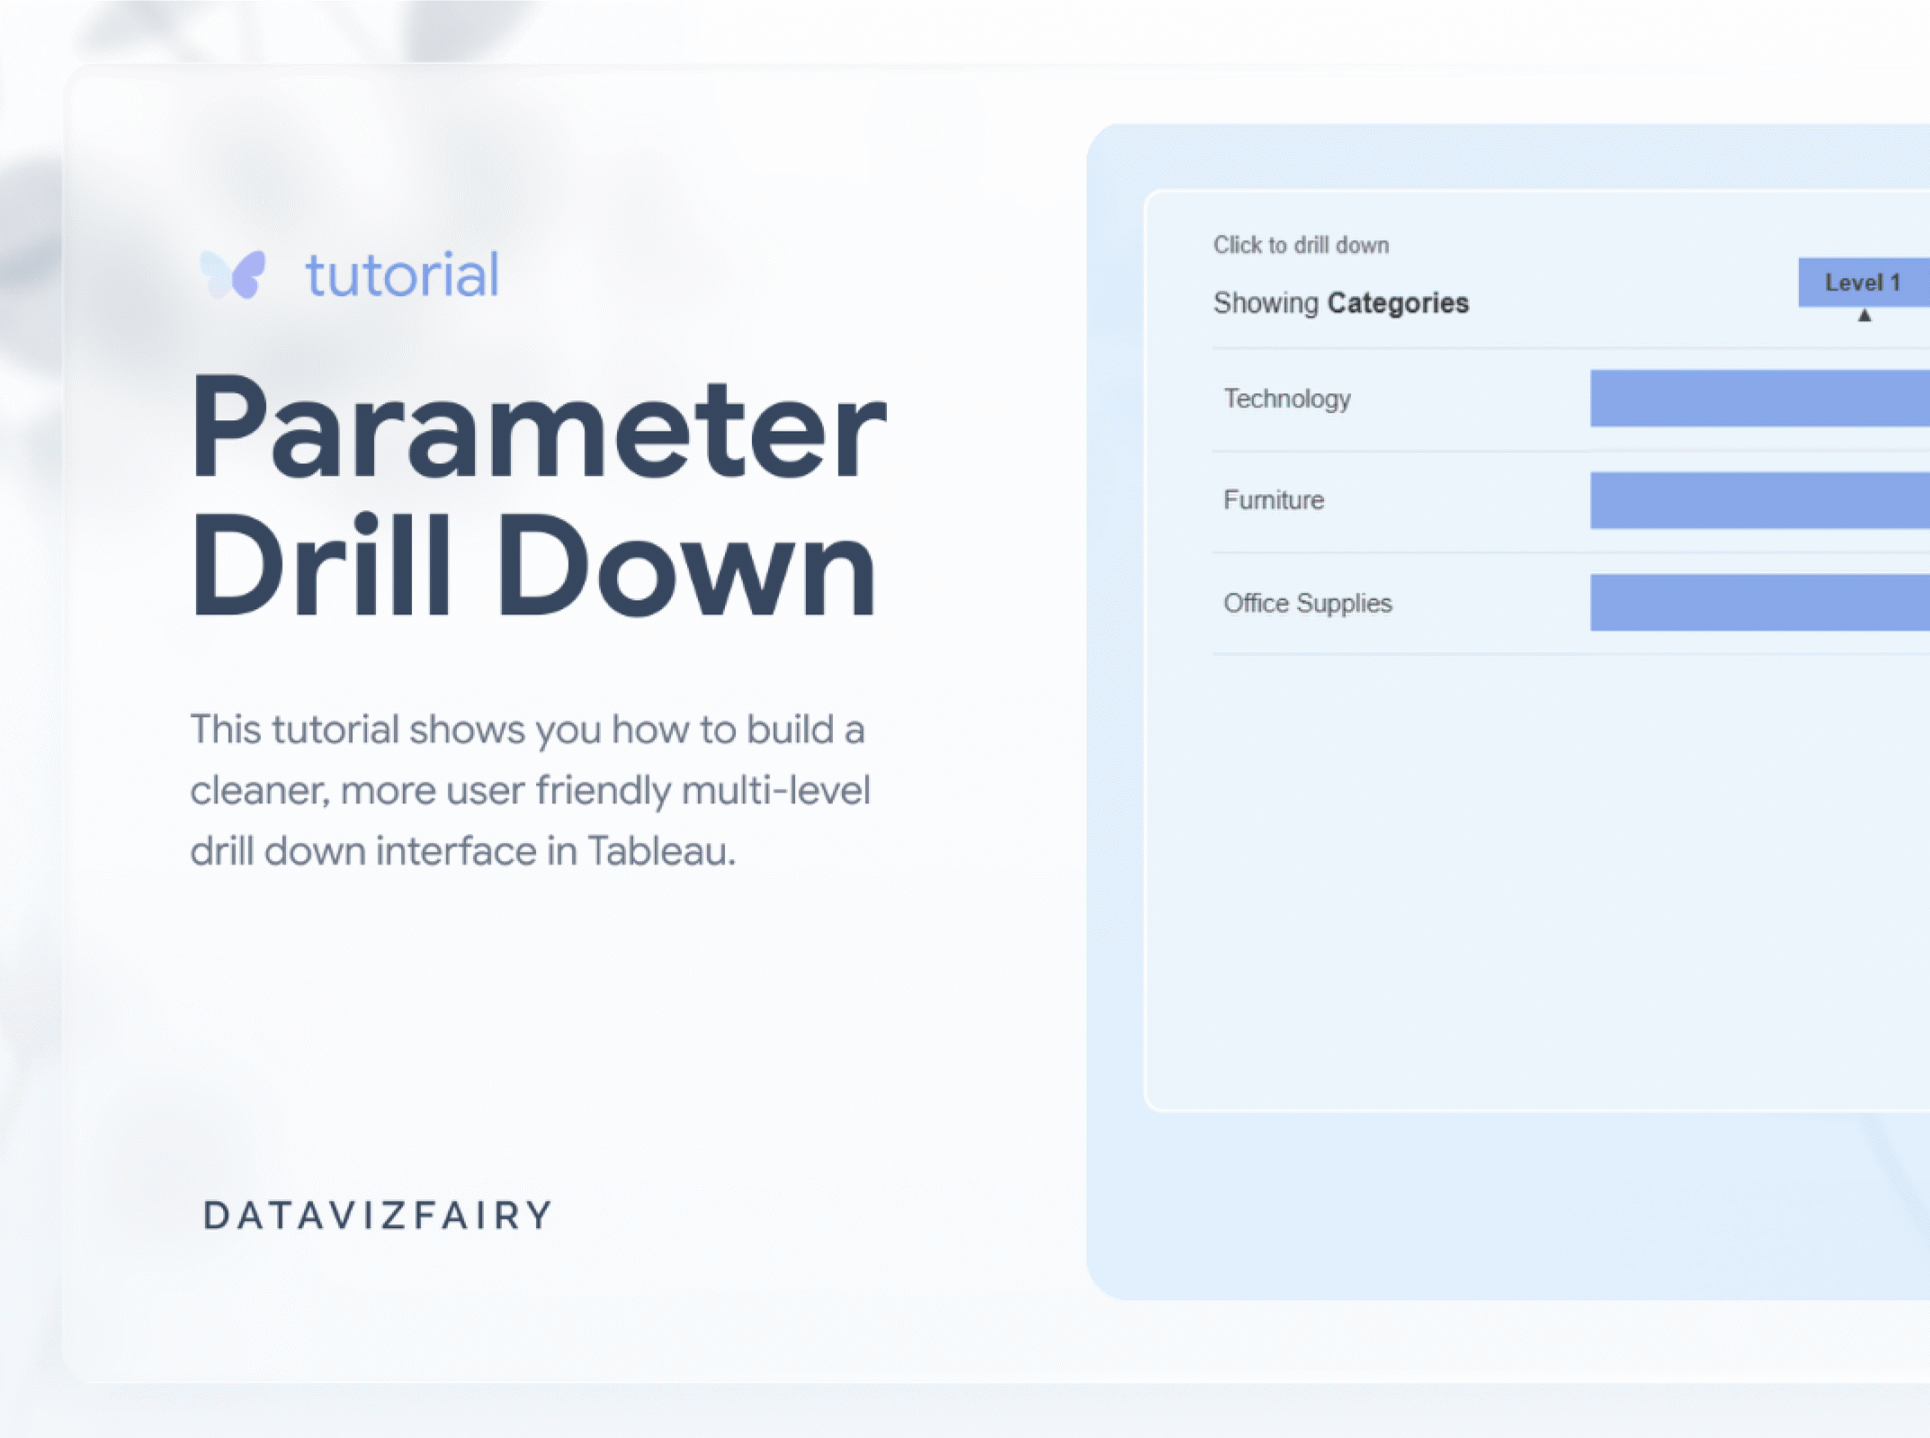
What is a drill down?
A drill down in Tableau lets you start with a high-level view, such as total sales by Category, and then click to see more detail, like Sub-Category, Manufacturer, and finally Product Name.
This approach keeps the initial view clean and uncluttered, while still allowing users to explore deeper levels of detail when they need to.
This blog post will walk you through step-by-step on how to build a parameter based drill down in Tableau Desktop.
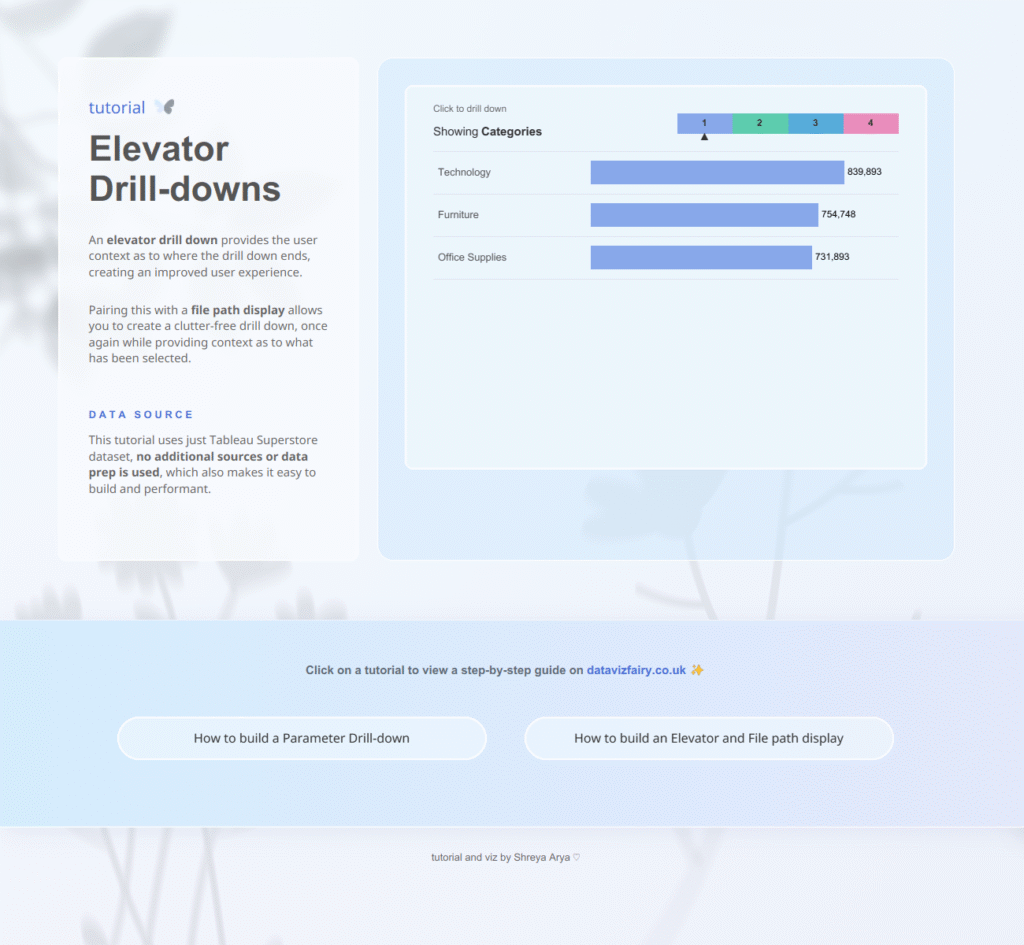
Video tutorial 🌷
Prefer to watch and follow along?
I’ve also created a video tutorial on YouTube that walks you through the process. If you’d rather read at your own pace, you’ll find the full step-by-step instructions written below in this blog.
Here’s how…
Step 1: Plan your drill down
Decide on which fields you would like to drill down through. This will go from low granularity to high granularity.
For this example, I’ll be using Tabelau’s Sample Superstore dataset – drilling down from:
Category → Sub-category → Manufacturer → Product Name
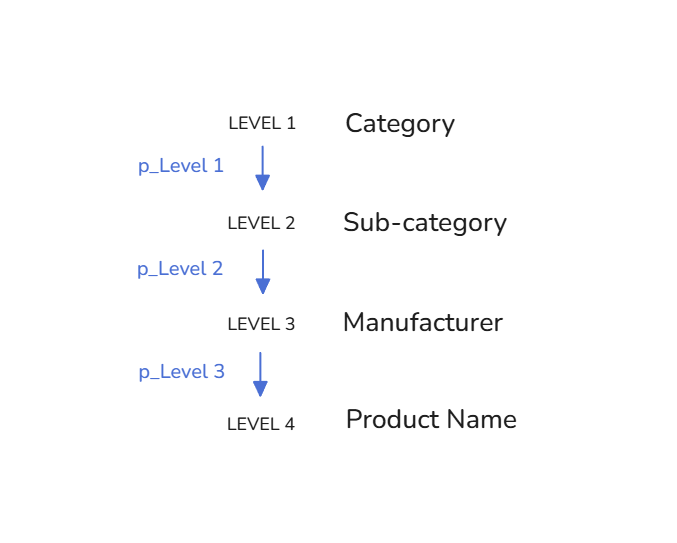
This gives us a 4-level drill down controlled by 3 parameter selections.
The first three levels need a parameter because the user will select a value to move to the next level. Product Name is our final level, so there’s no need for another parameter after that.
Once you know your hierarchy, we can start building it in Tableau.
Step 2: Create the Parameters
We’ll start by creating the three parameters that will store the user’s selections as they drill down.
- Click on the drop- down arrow next to the search bar > Create Parameter.
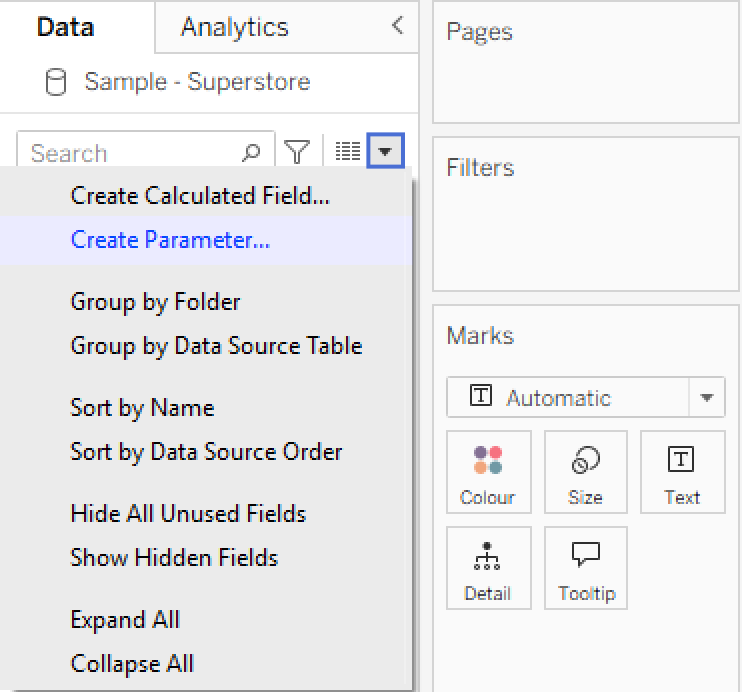
- I am configuring all three parameters: p_Level 1, p_Level 2 and p_Level 3, in the same way.
- Data type: String
- Current value: [empty]
- Allowable values: All
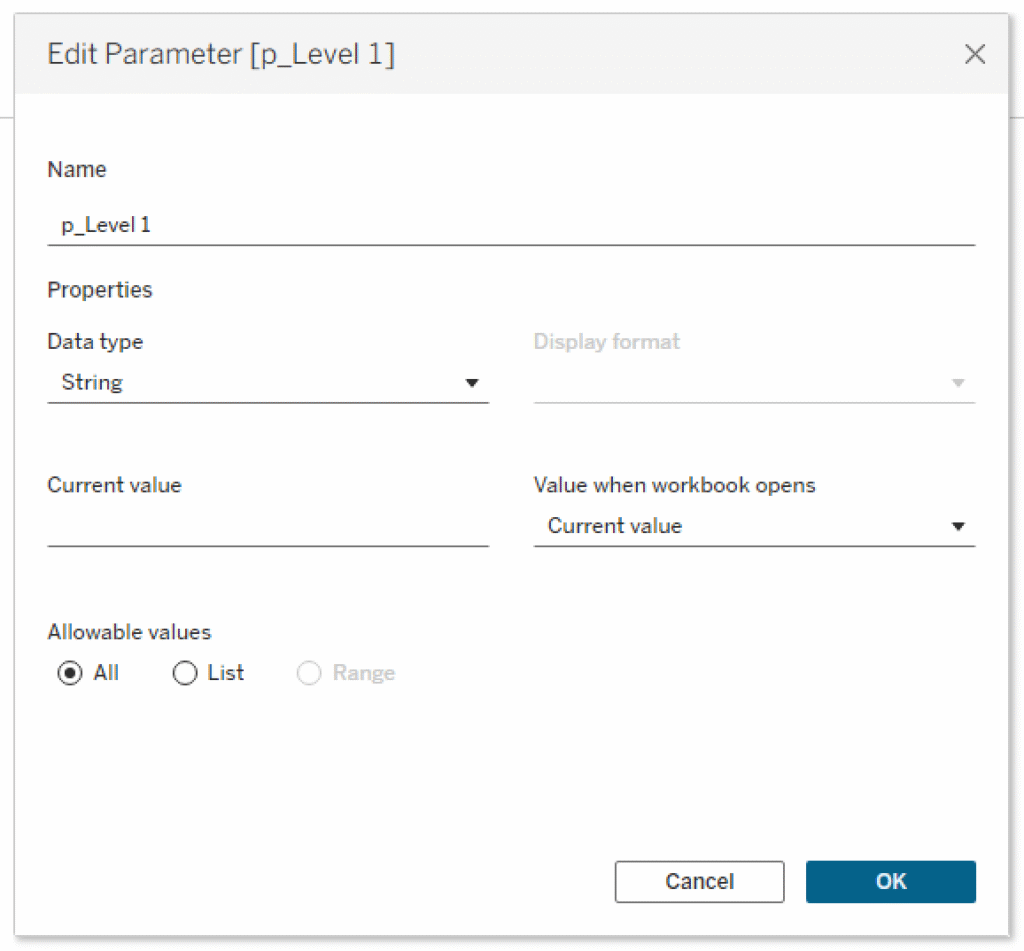
I like to use the naming prefix p_ for parameters, so they’re easier to find when writing calculations later ✨
Checkpoint 🏁
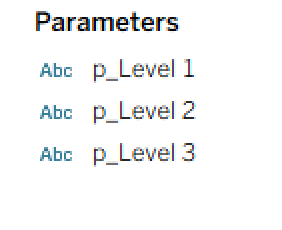
You should now have all of your parameter fields ready to use!
Step 3: Calculations
Next, we’ll create the calculations that make the drill-down work.
There are 7 calculations in total. I recommend creating them in the order below, as some of the later calculations rely on the earlier ones.
Checkpoint 🏁
You should now have all the calculations you need to build the parameter drill down!
I like to group mine into a folder so I can access them easily.
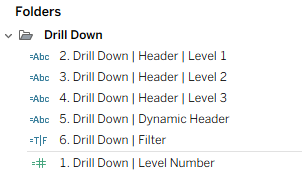
✨ If you’d like to learn how to organise calculations into folder, check out this Tableau Help Article: Organize and Customize Fields in the Data Pane
Step 4: Build the Chart
Chart Foundations
Now that the logic is in place, we can start building the actual chart.
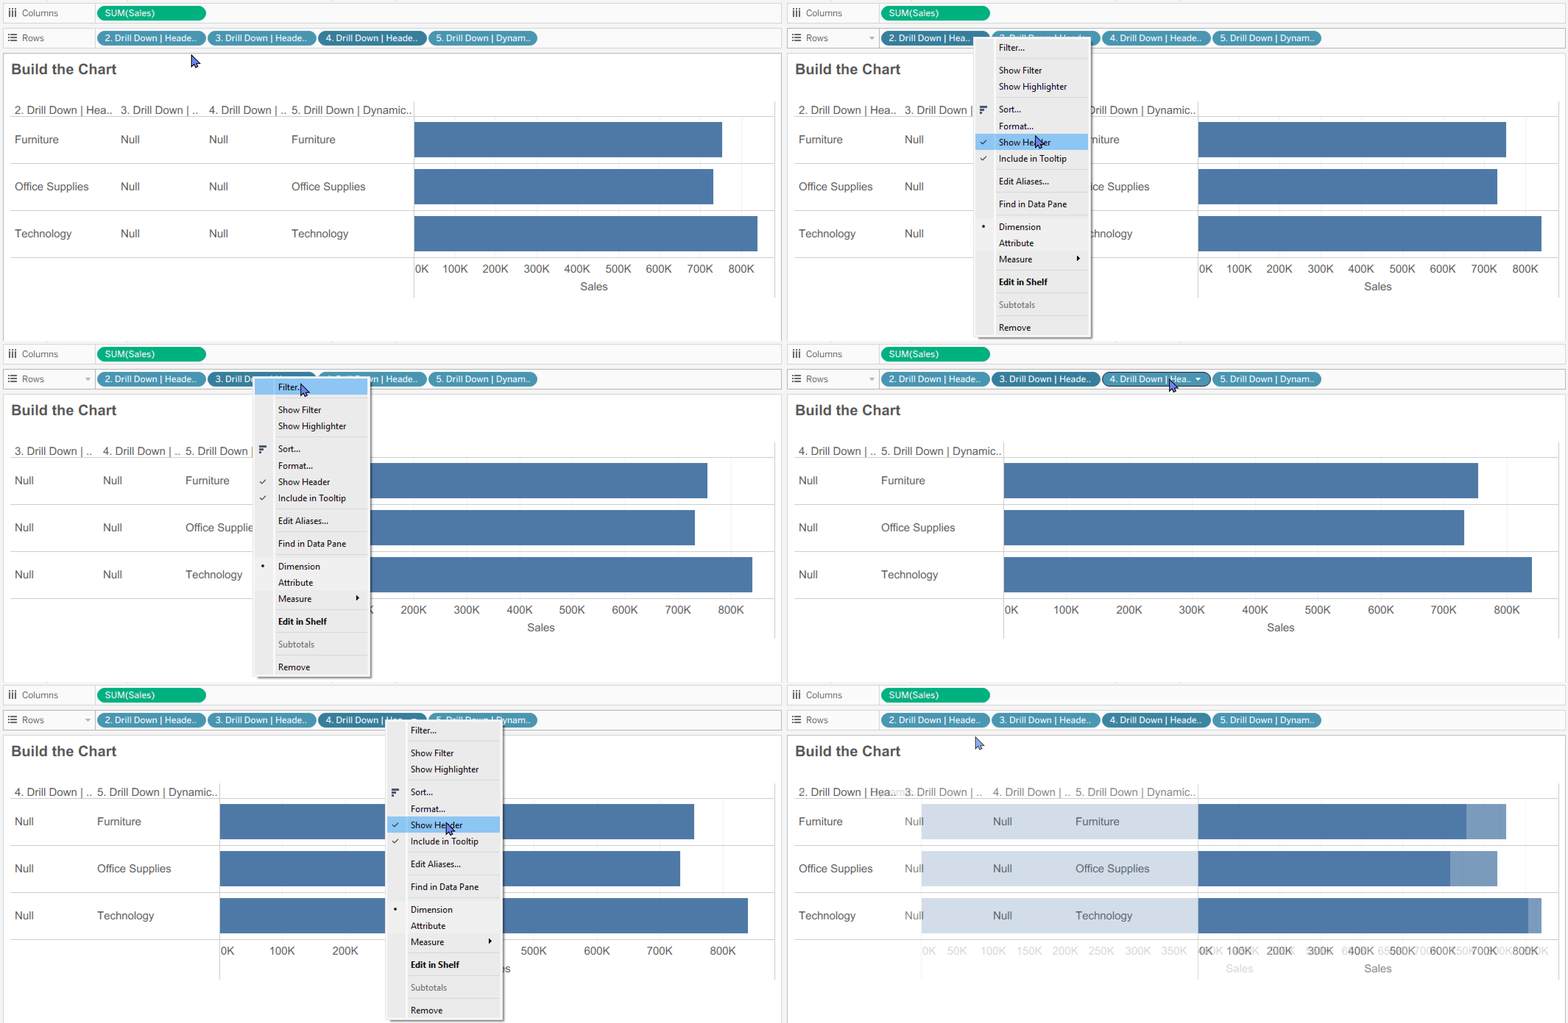
- Add the Fields to Rows
- Drag calculations 2 – 5 onto Rows, in this order:
2. Drill Down | Header | Level 13. Drill Down | Header | Level 24. Drill Down | Header | Level 35. Drill Down | Dynamic Header
- Place SUM(Sales), or your preferred measure onto the Columns shelf.
- Set the Worksheet fit to Fit Width.
- Drag calculations 2 – 5 onto Rows, in this order:

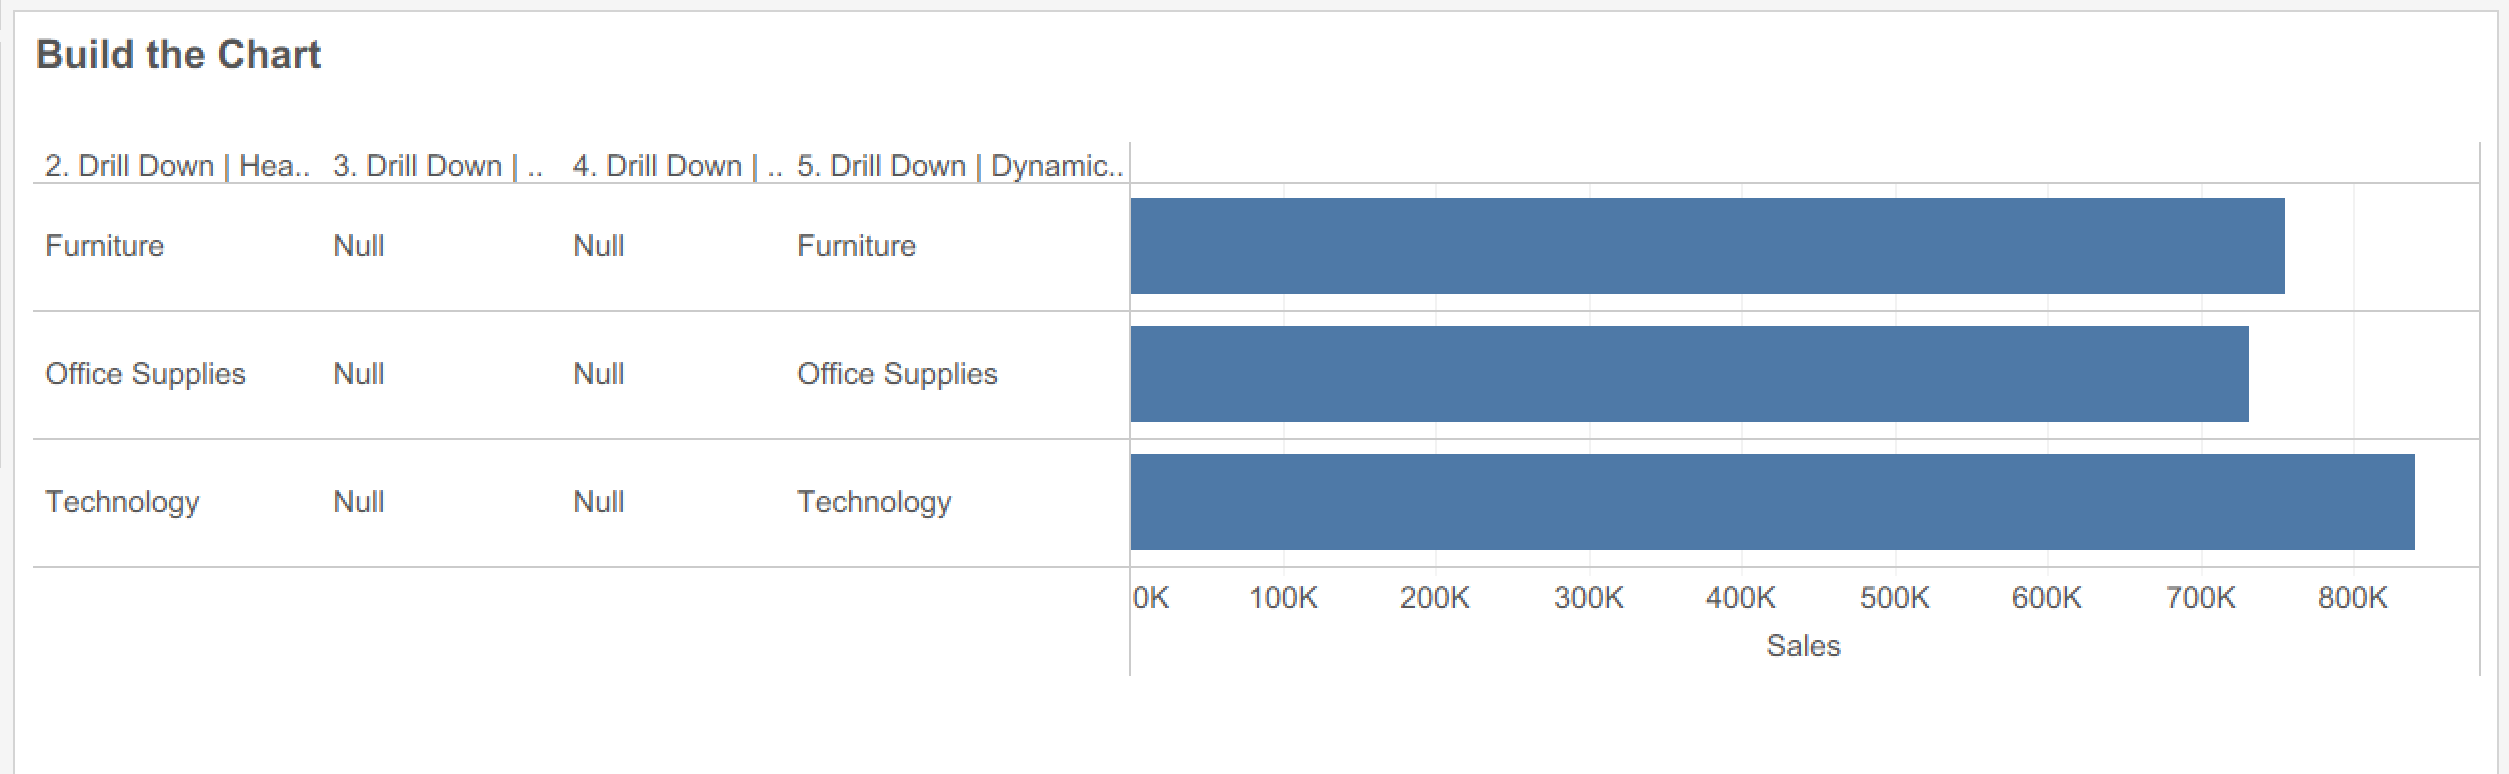
- Hide the helper Headers
- Right-click the first three Header pills and deselect Show Header.
Only the Dynamic Header should remain visible.
- Right-click the first three Header pills and deselect Show Header.
- Add the Drill-down Filter
Drag 6. Drill Down | Filter onto the Filters shelf, and select True.
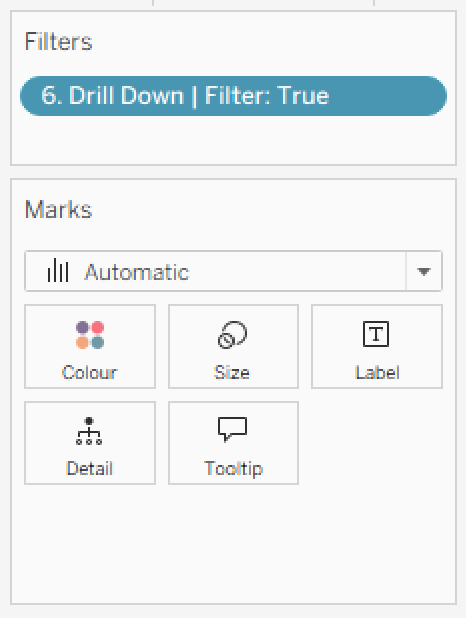
You should now have a basic Level 1 chart showing Sales by Category.
Initial Formatting
Before we move on, it’s worth giving the chart some initial formatting so it’s clean and easy to read.
For my example, I’ve:
- added value labels to the bars
- formatted the measure so the values are easy to read
- removed unnecessary gridlines, dividers and axes
- adjusted the bar sizing and spacing
- removed the field label for
Drill Down | Dynamic Header.
Sort the Headers
Next, sort each of the Header pills by your measure in descending order.
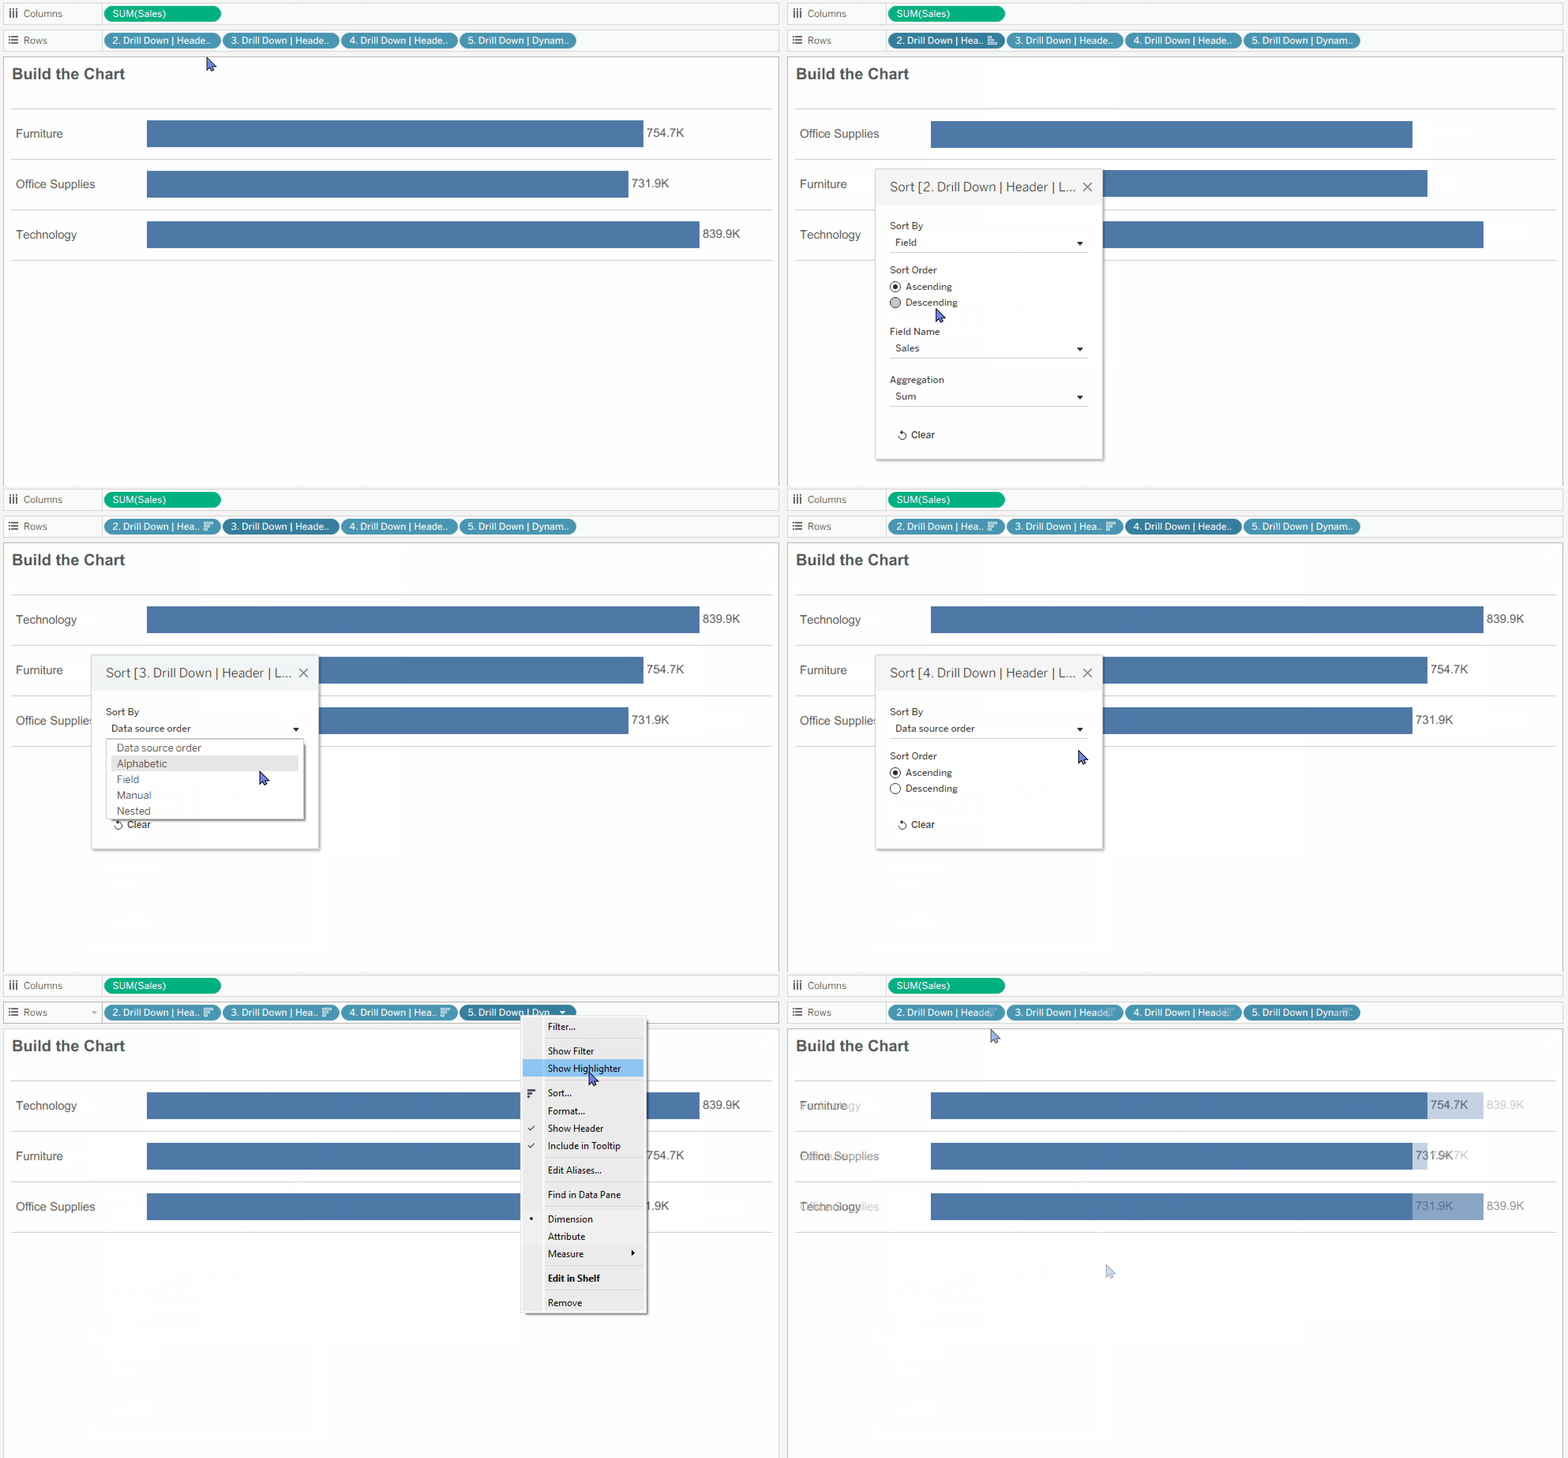
💡 Tip: Configure the sort by right-clicking each Header pill → Sort… rather than using the toolbar shortcut – sometimes the shortcut sort doesn’t hold.
Add the Dynamic title
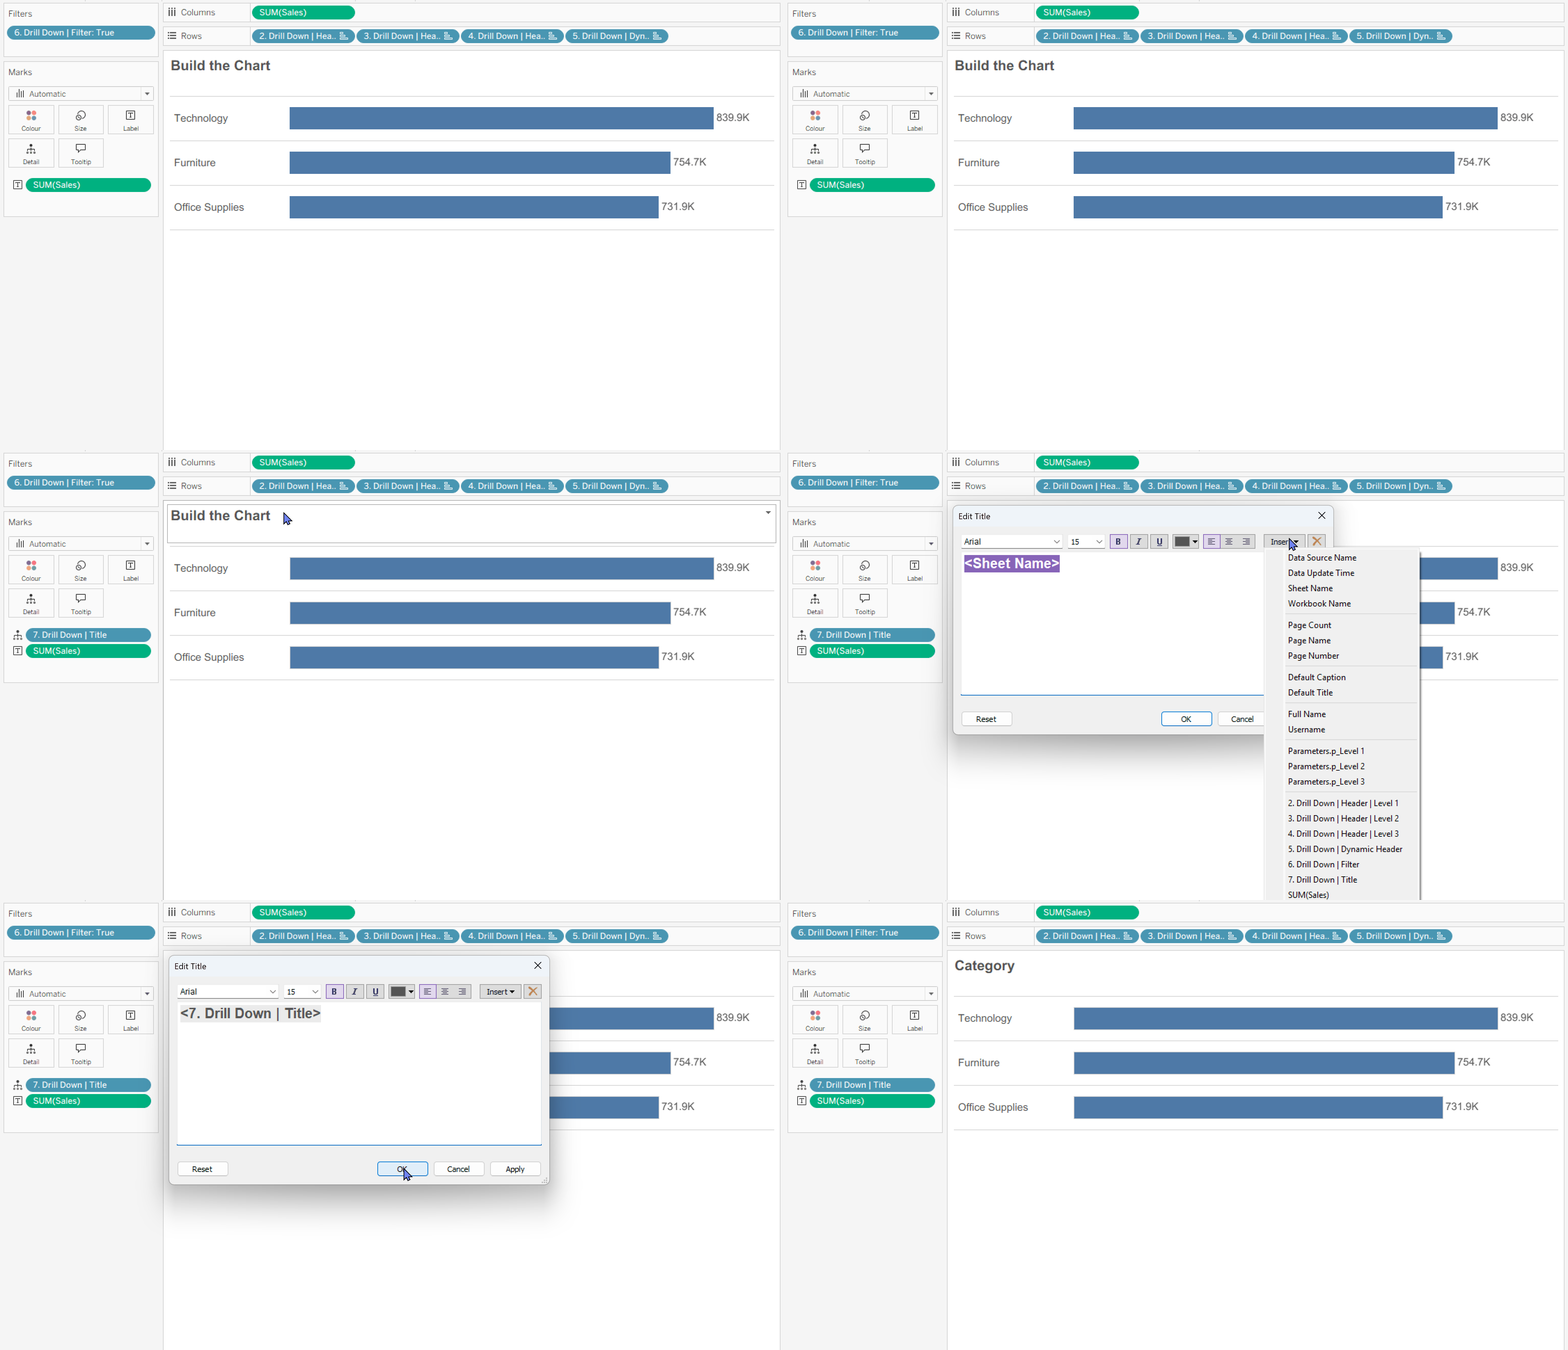
Place 7. Drill Down | Title onto Detail on the Marks card.
Then edit the worksheet title and insert this field so it updates as the user moves through the drill-down.
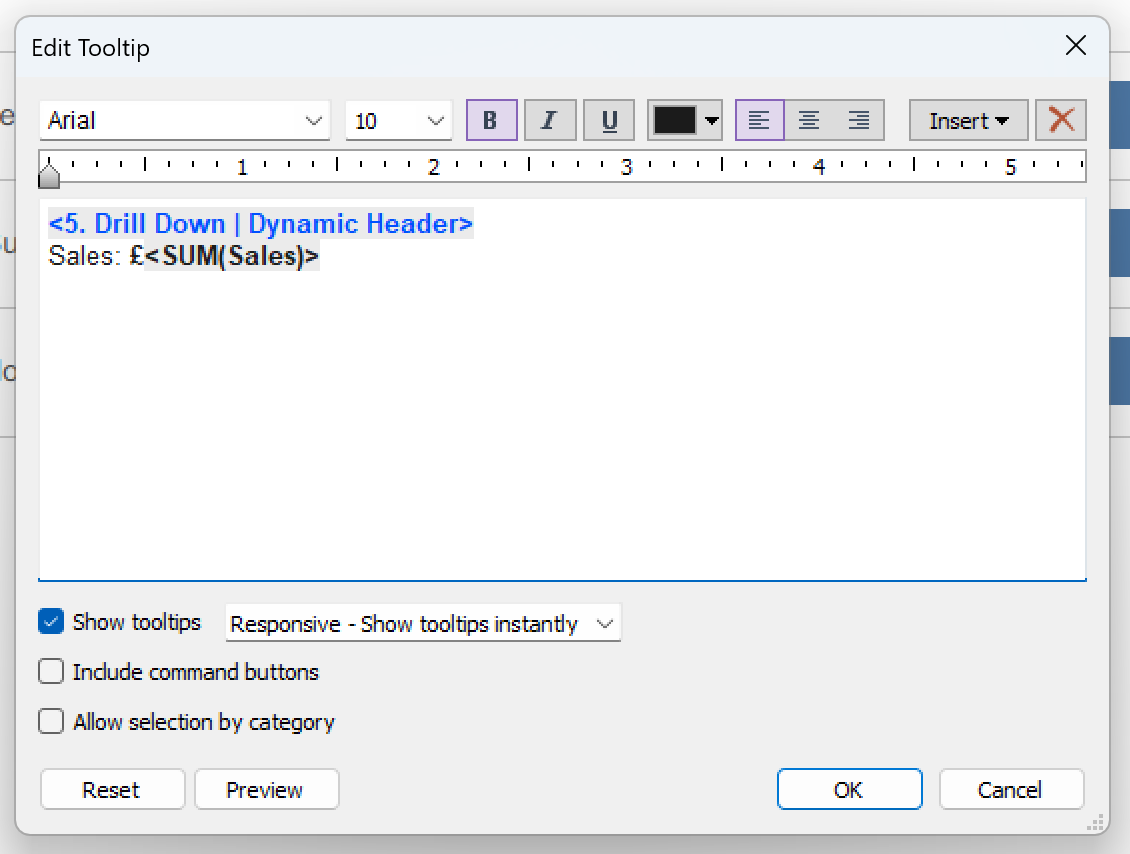
Tidy the Tooltip
Finally, edit the tooltip to show only the information that’s useful to the user.
For my example, I’m keeping the current drill-down value and Sales.
Step 5: Dashboard Actions!
Navigate to a new Dashboard and place your drill-down bar chart onto the canvas.
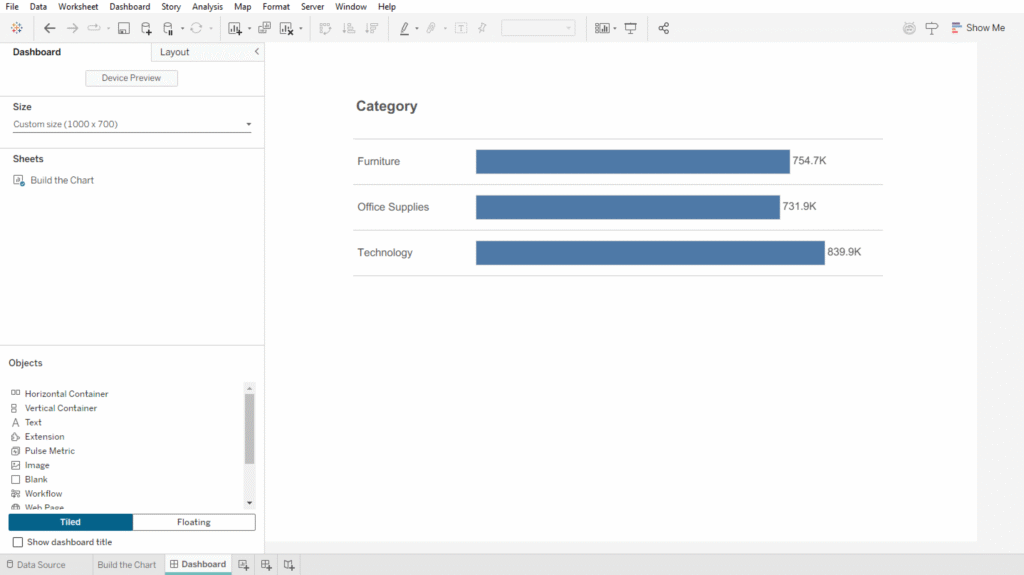
Now we’ll create three Parameter Actions, one for each selectable level.
Navigate to:
Dashboard → Actions… → Add Action → Change Parameter
Configure the parameter actions as shown below.
Example: Drill – Level 1
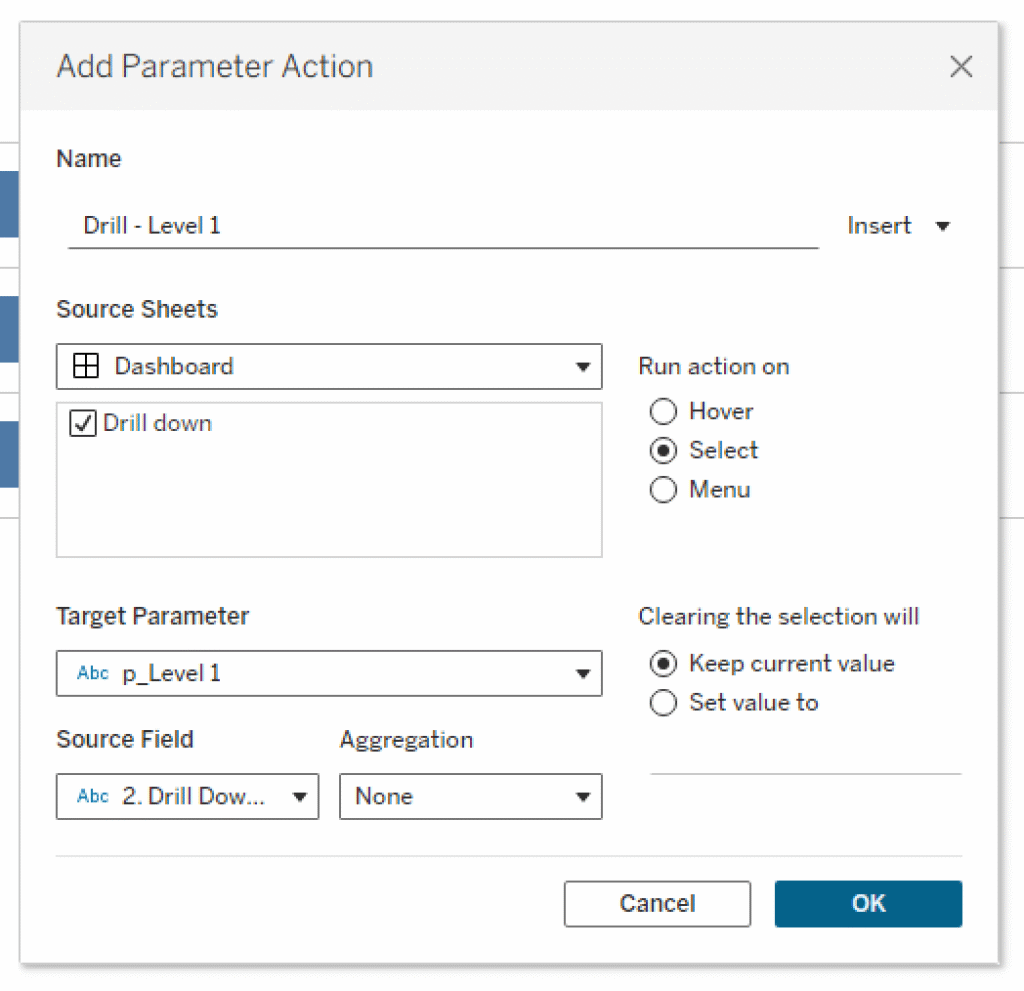
The logic is the same for each action:
| Name | Drill – Level 1 | Drill – Level 2 | Drill – Level 3 |
| Source Sheet | Drill down (bar chart) | Drill down (bar chart) | Drill down (bar chart) |
| Target Parameter | p_Level 1 | p_Level 2 | p_Level 3 |
| Source Field | 2. Drill down | Header | Level 2 | 3. Drill down | Header | Level 2 | 4. Drill down | Header | Level 3 |
| Run action on | Select | Select | Select |
Now try clicking through the chart on your dashboard.
You should be able to move through:
Category → Sub-Category → Manufacturer → Product Name
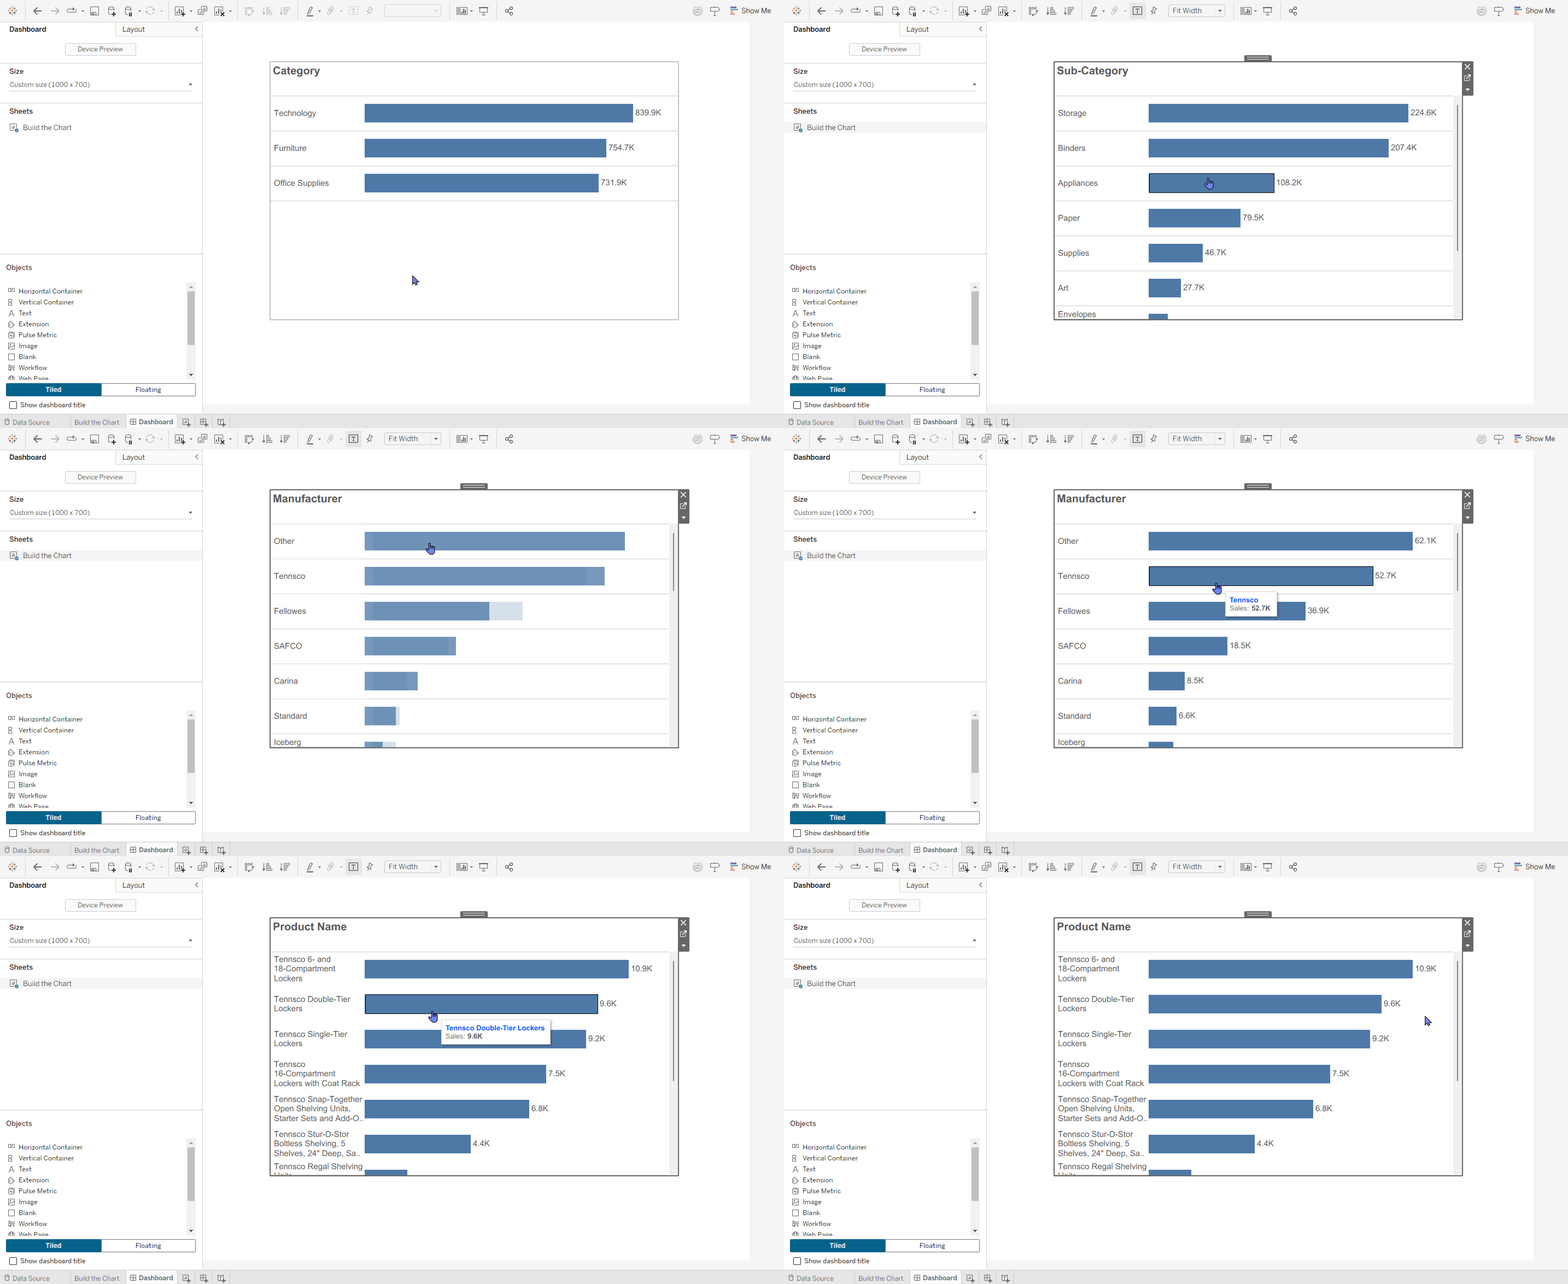
If your sorting isn’t working, make sure you configured it by right-clicking the Header pills → Sort… rather than using the toolbar shortcut.
Great, the drill-down itself is now working! ✨
But there’s one problem: once the user has drilled down, there’s no easy way for them to return to Level 1.
So next, we’ll add a Reset button.
Step 6: Reset button
Build the Reset worksheet
Start by navigating to a new worksheet.
- Double-click within the marks card to create a custom field and write “Reset”, within quotations so it registers as a string. This will be the text on display.
- Double-click underneath this calc to add a new calc “” (empty quotations). This is to reset the parameters to be empty.
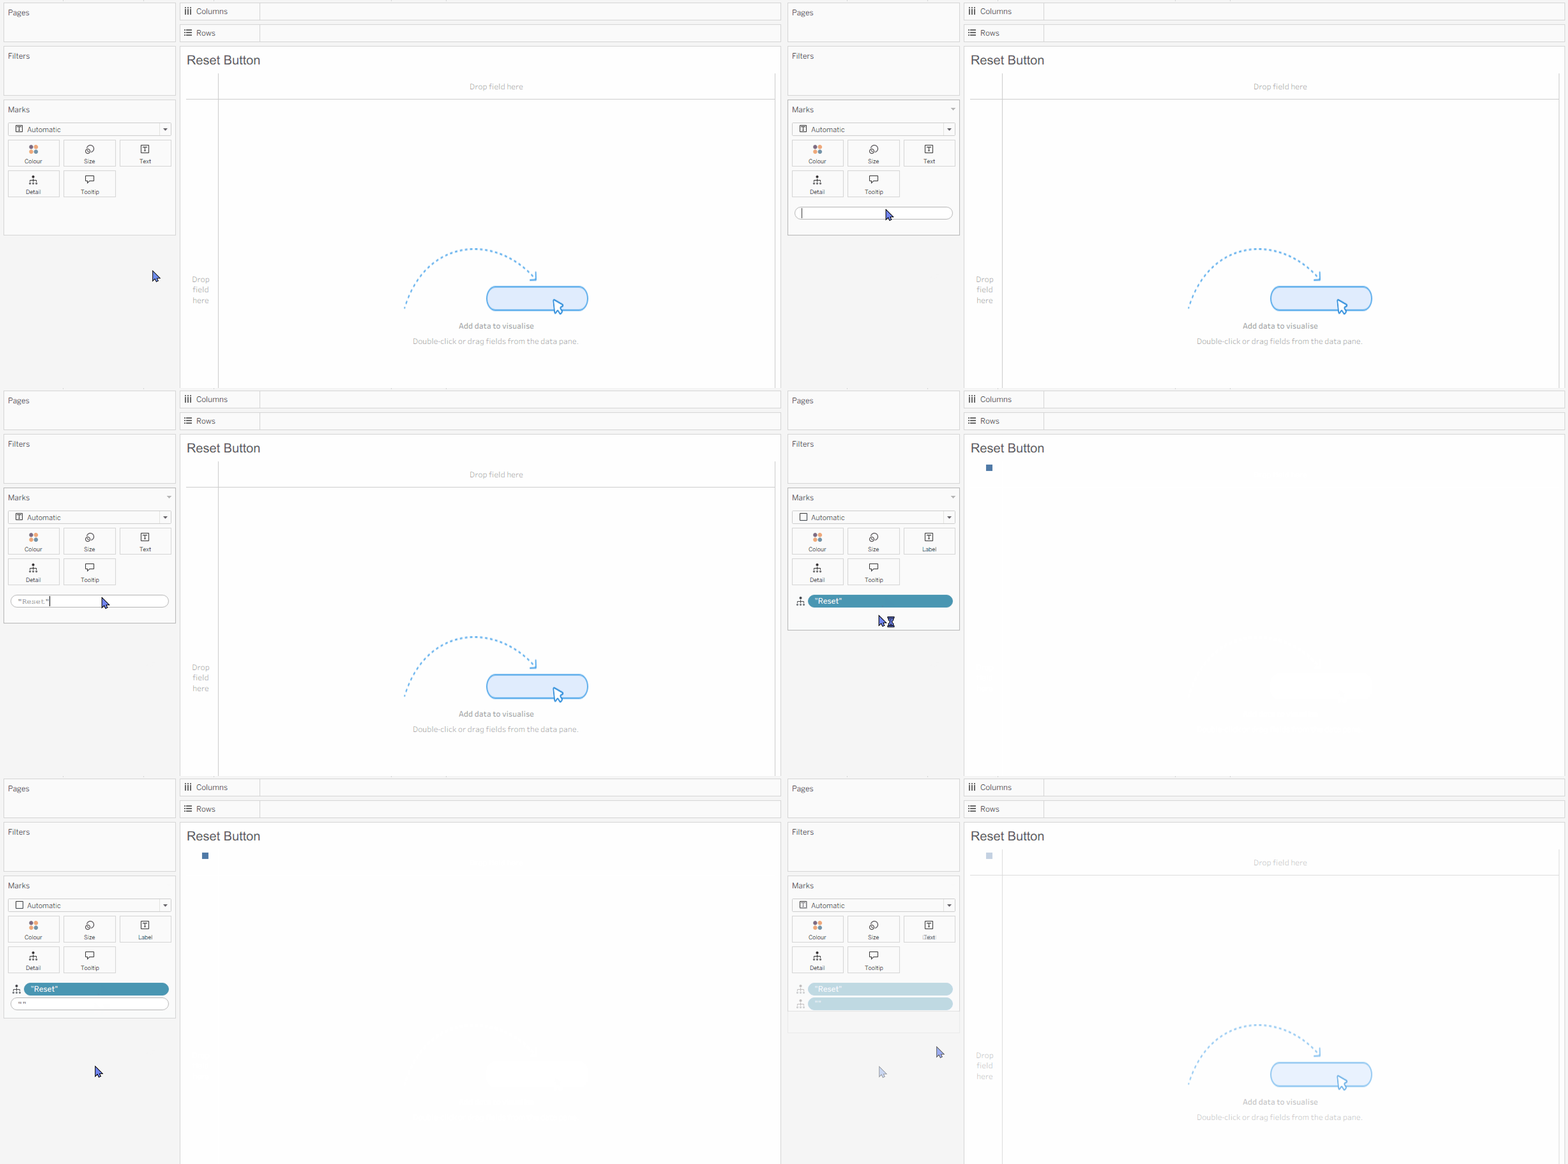
- Drag the “Reset” pill onto Text, and make the worksheet fit Entire View.
- Centre the text to be in the middle and also turn off tooltips.
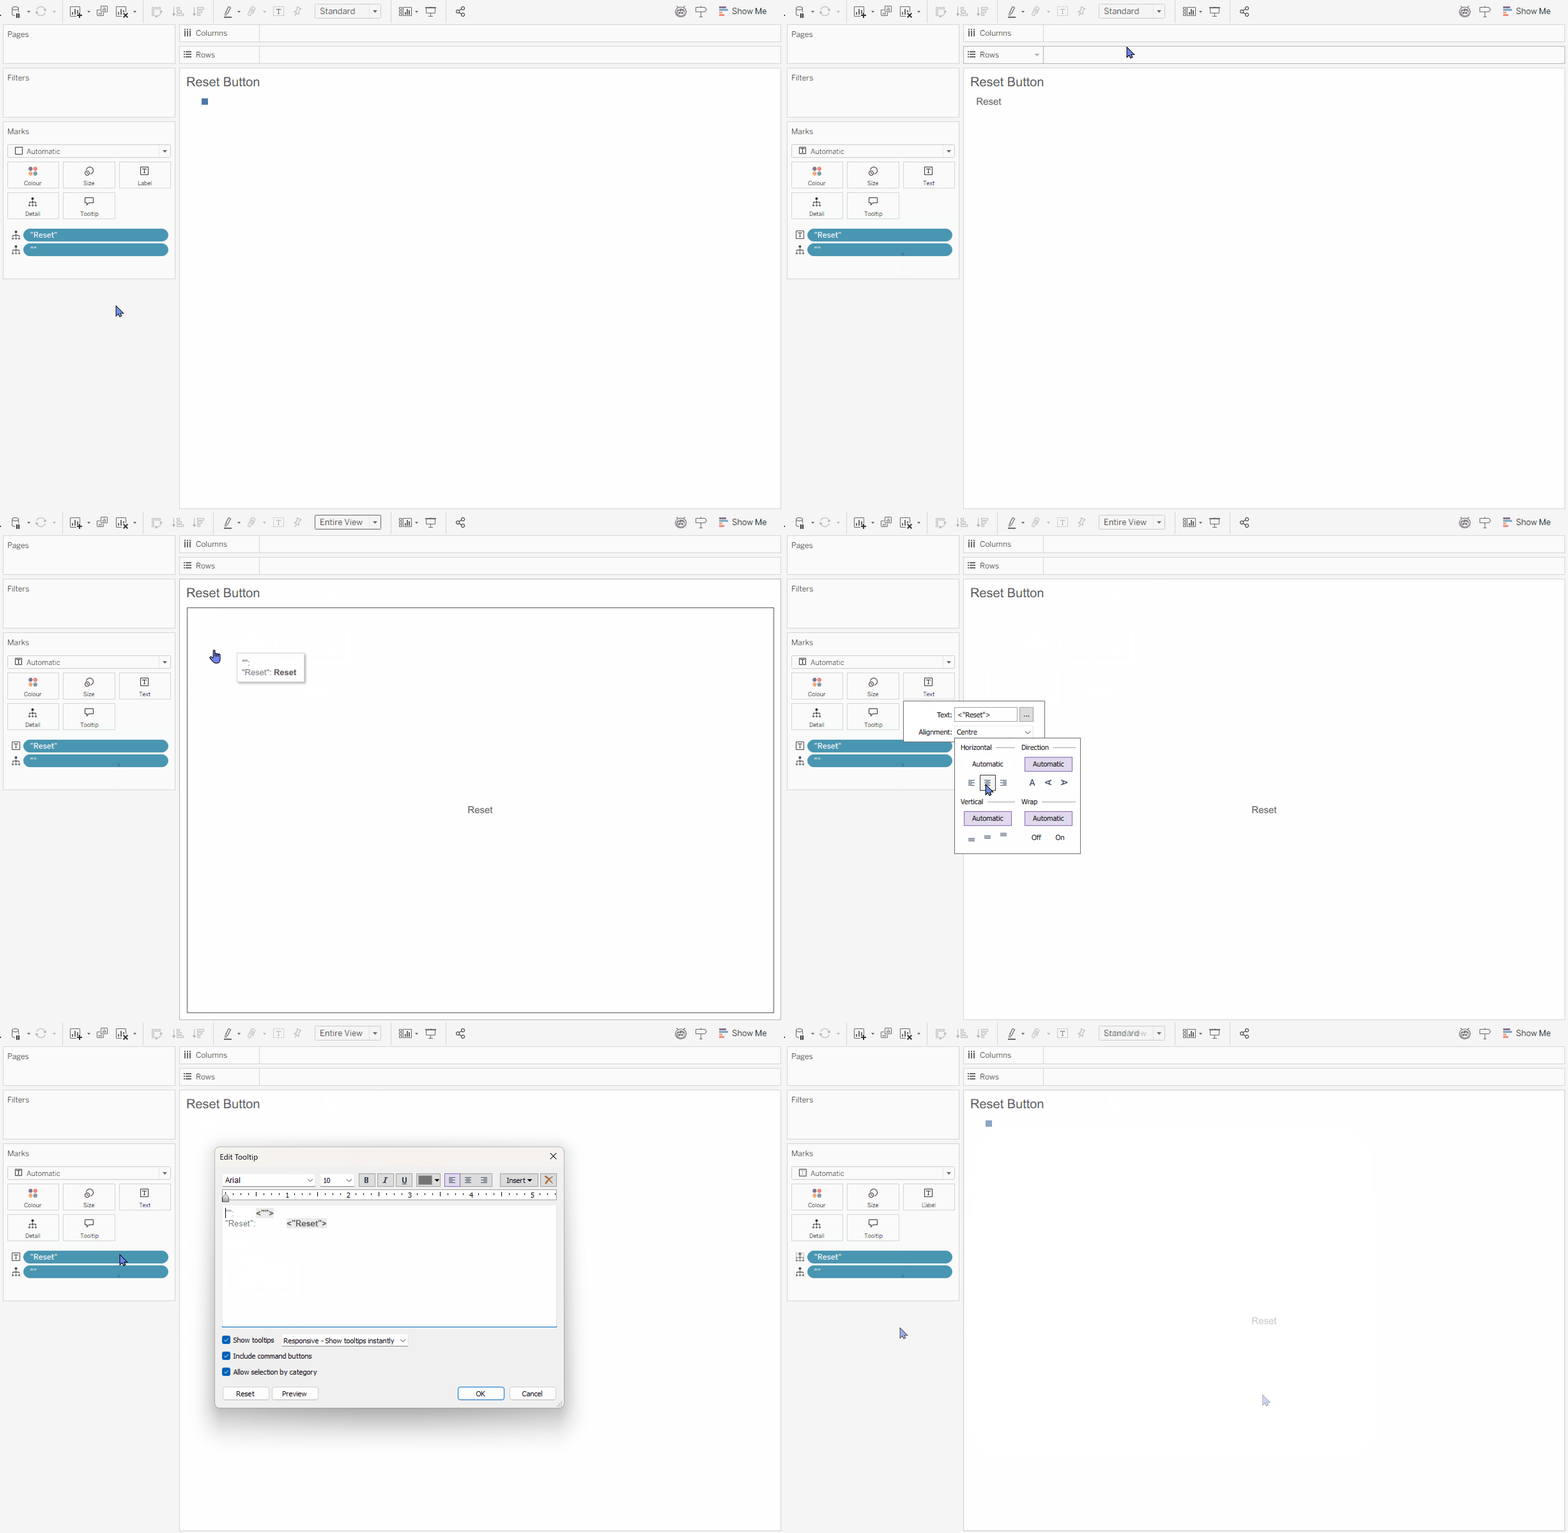
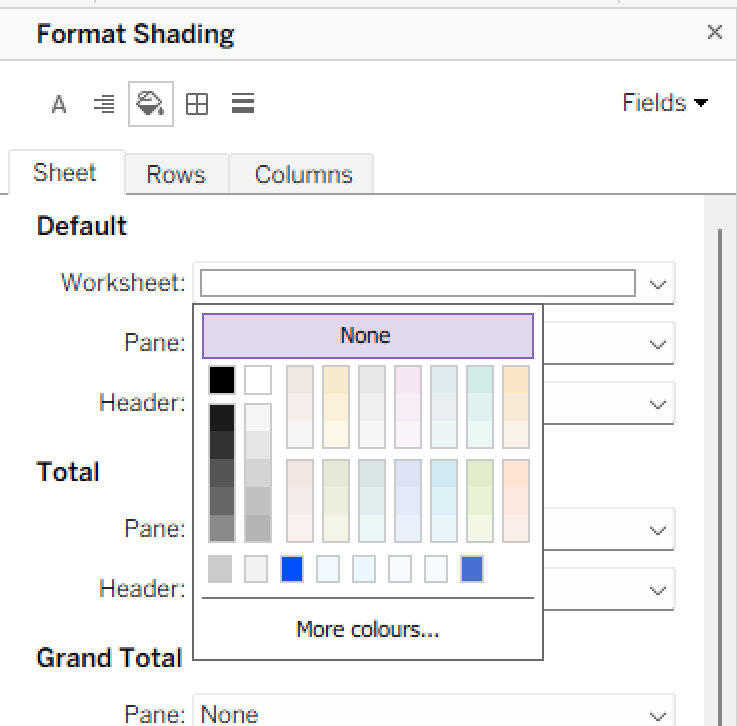
- To make the button easier to customise later, remove the worksheet background.
- Navigate to: Format→ Shading…
- Set the worksheet shading to None.
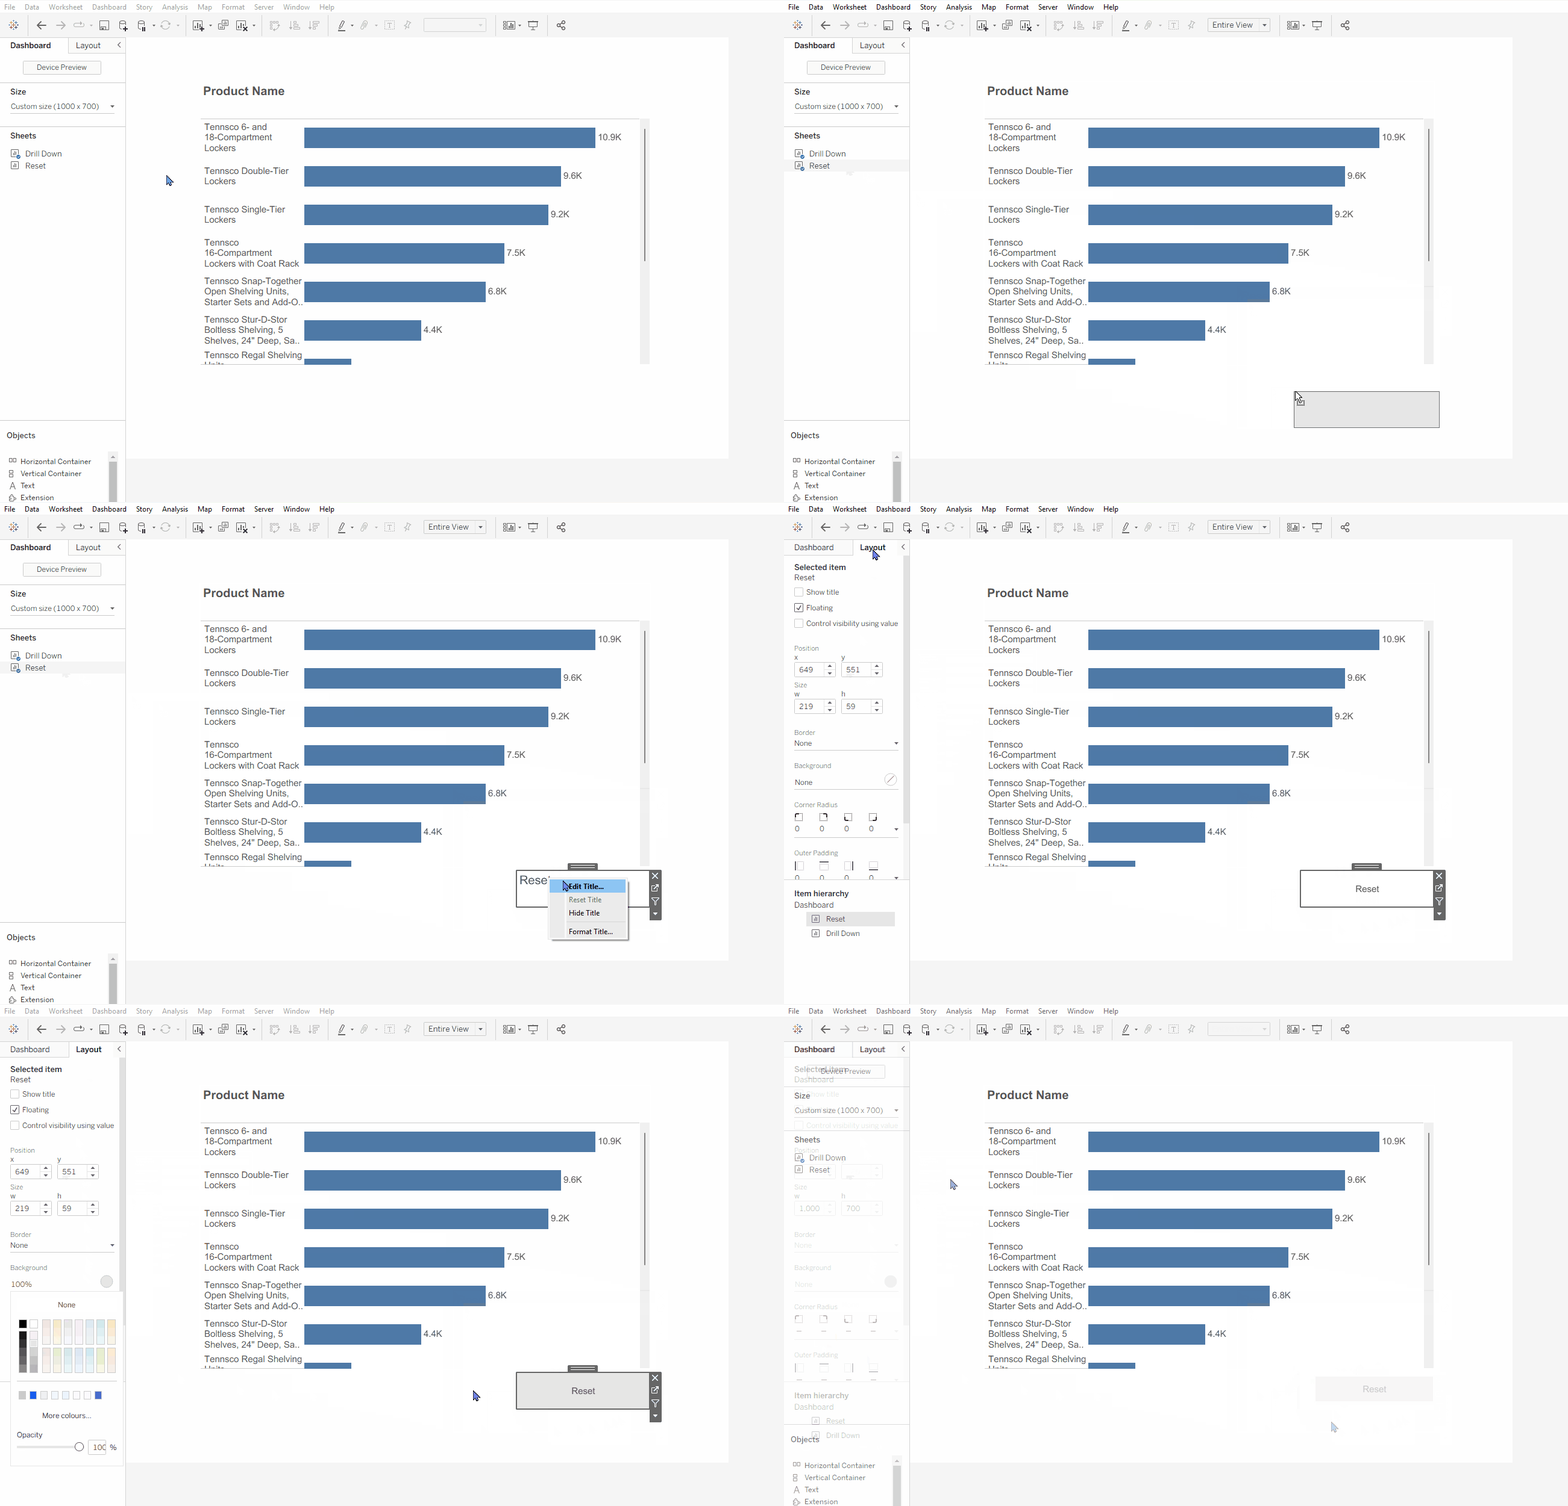
Now add the Reset worksheet to your dashboard.
- I’m giving it a grey background so it stands out as a button.
Configure the Reset action
Now we’ll create three more Parameter Actions, this time using our Reset worksheet.
Each one will pass the empty "" value into our parameters.
Navigate to:
Dashboard → Actions… → Add Action → Change Parameter
Configure the parameter actions as shown below.
Example: RESET – Level 1
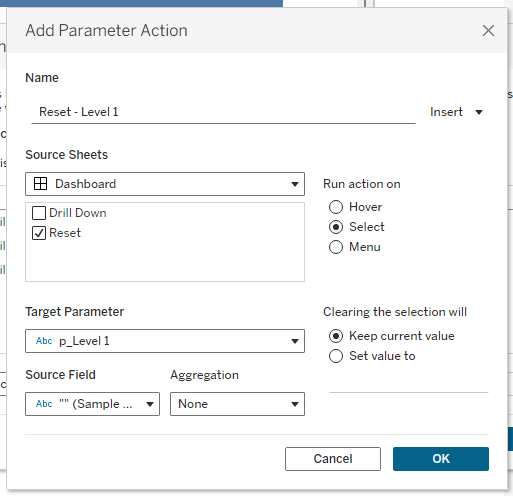
The logic is the same for each action:
| Name | Reset – Level 1 | Reset – Level 2 | Reset – Level 3 |
| Source Sheet | Reset (button) | Reset (button) | Reset (button) |
| Target Parameter | p_Level 1 | p_Level 2 | p_Level 3 |
| Source Field | “” | “” | “” |
| Run action on | Select | Select | Selec |
Once all three actions are configured, your Dashboard Actions window should contain six actions:
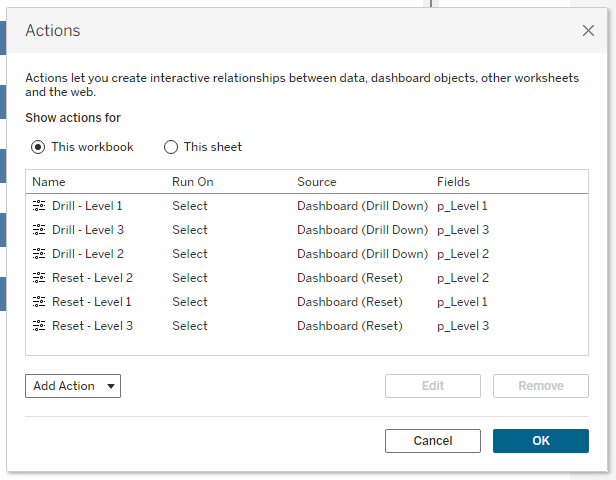
Now try drilling down a few levels and selecting Reset.
All three parameters should return to empty values, taking you back to Category / Level 1.
Checkpoint 🏁
You should now be able to:
Drill down → move through the levels → Reset → return to Level 1
Step 7: Final Tweaks
Now that everything works, there are a couple of optional tweaks we can make to polish the interaction.
Reset Button Visibility
We only need the Reset button when the user has actually drilled down.
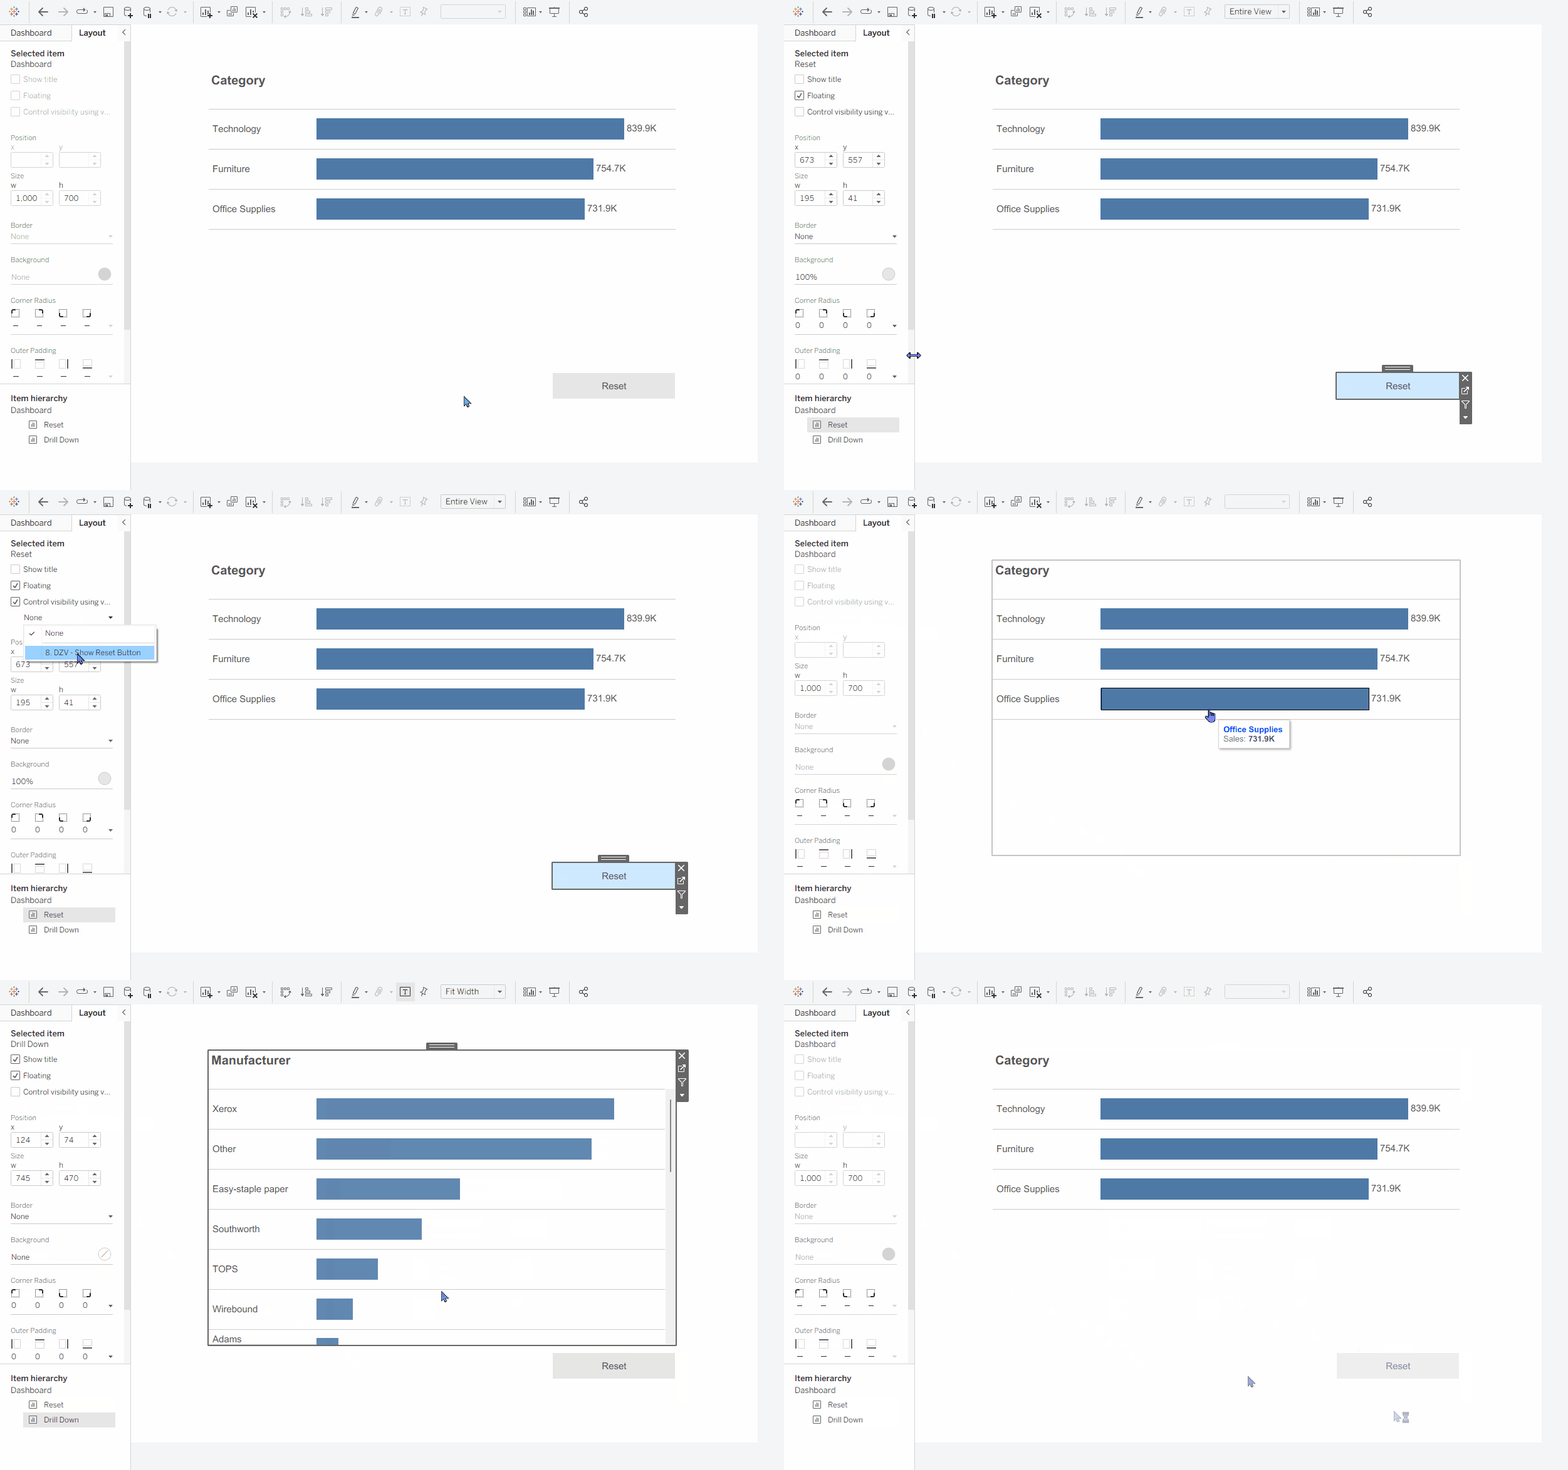
At Level 1, there’s nothing to reset, so we can hide it using Dynamic Zone Visibility.
- Create the following calculation:
8. DZV – Show Reset Button
If the drill-down is at Level 1, the reset button will not show.
[1. Drill Down | Level Number] != 1- Navigate back to the dashboard view.
- With the Layout pane open, click on the Reset Button sheet and tick, Control visibility using value. Select the 8. DZV – Show Reset Button calculation.
Now the button will only show past Level 1.
Coloured Levels
You can also use colour to make the different drill-down levels easier to distinguish.
- Navigate back to your drill-down worksheet and show the three parameter controls.
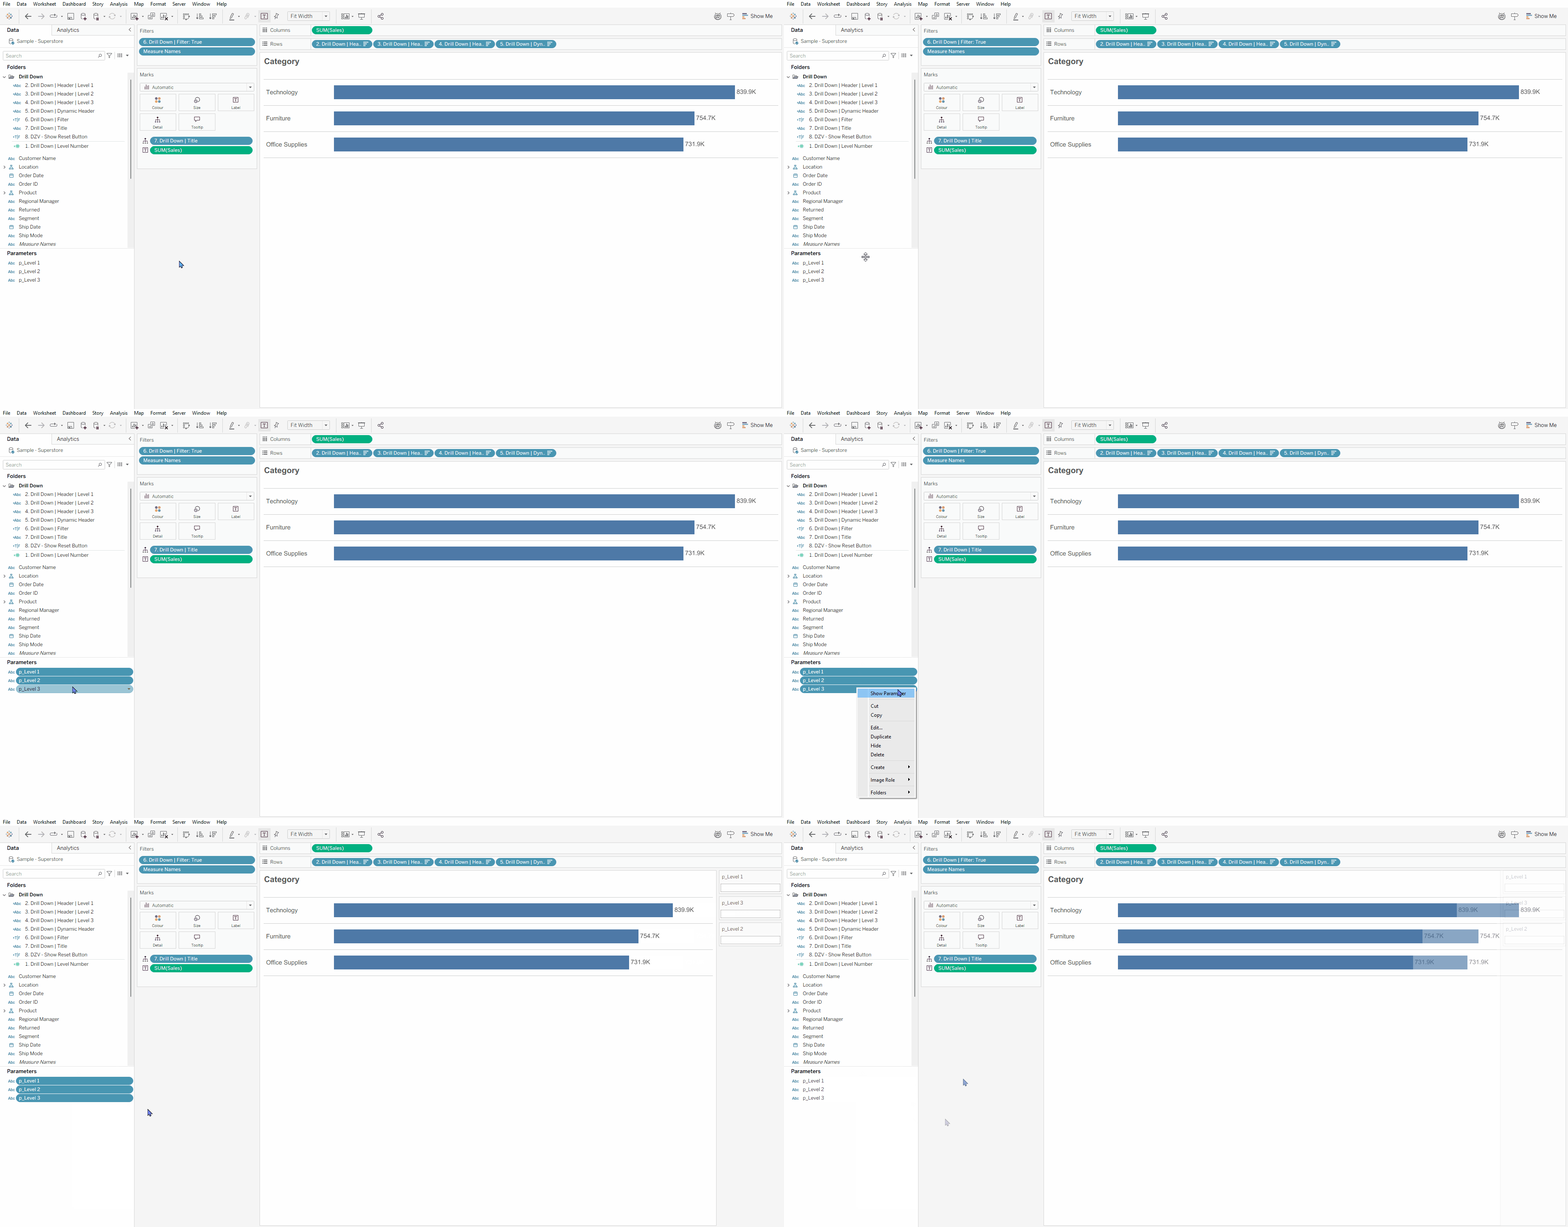
✨ TIP: Hold Shift + click on the parameter fields to select them together, then right-click to Show Parameters. This saves you from having to show them individually.
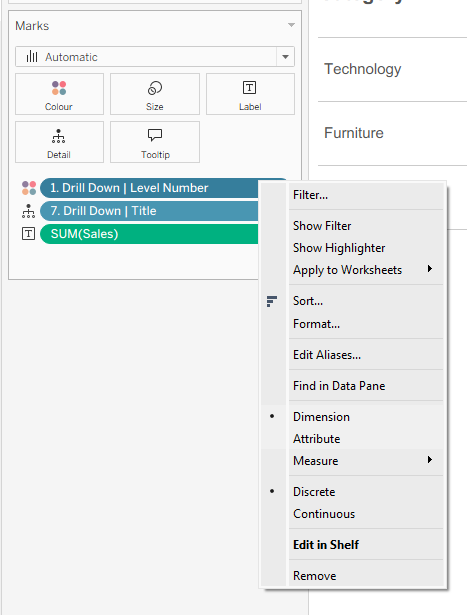
- Drag
1. Drill Down | Level Numberonto Colour on the marks card, and make it a Discrete Dimension, as shown below.
- Now work through the levels one at a time.
- At Level 1, choose your first colour.
- Then populate
p_Level 1to move to Level 2 and assign your second colour. - Continue through Levels 3 and 4 until each has the colour you want.
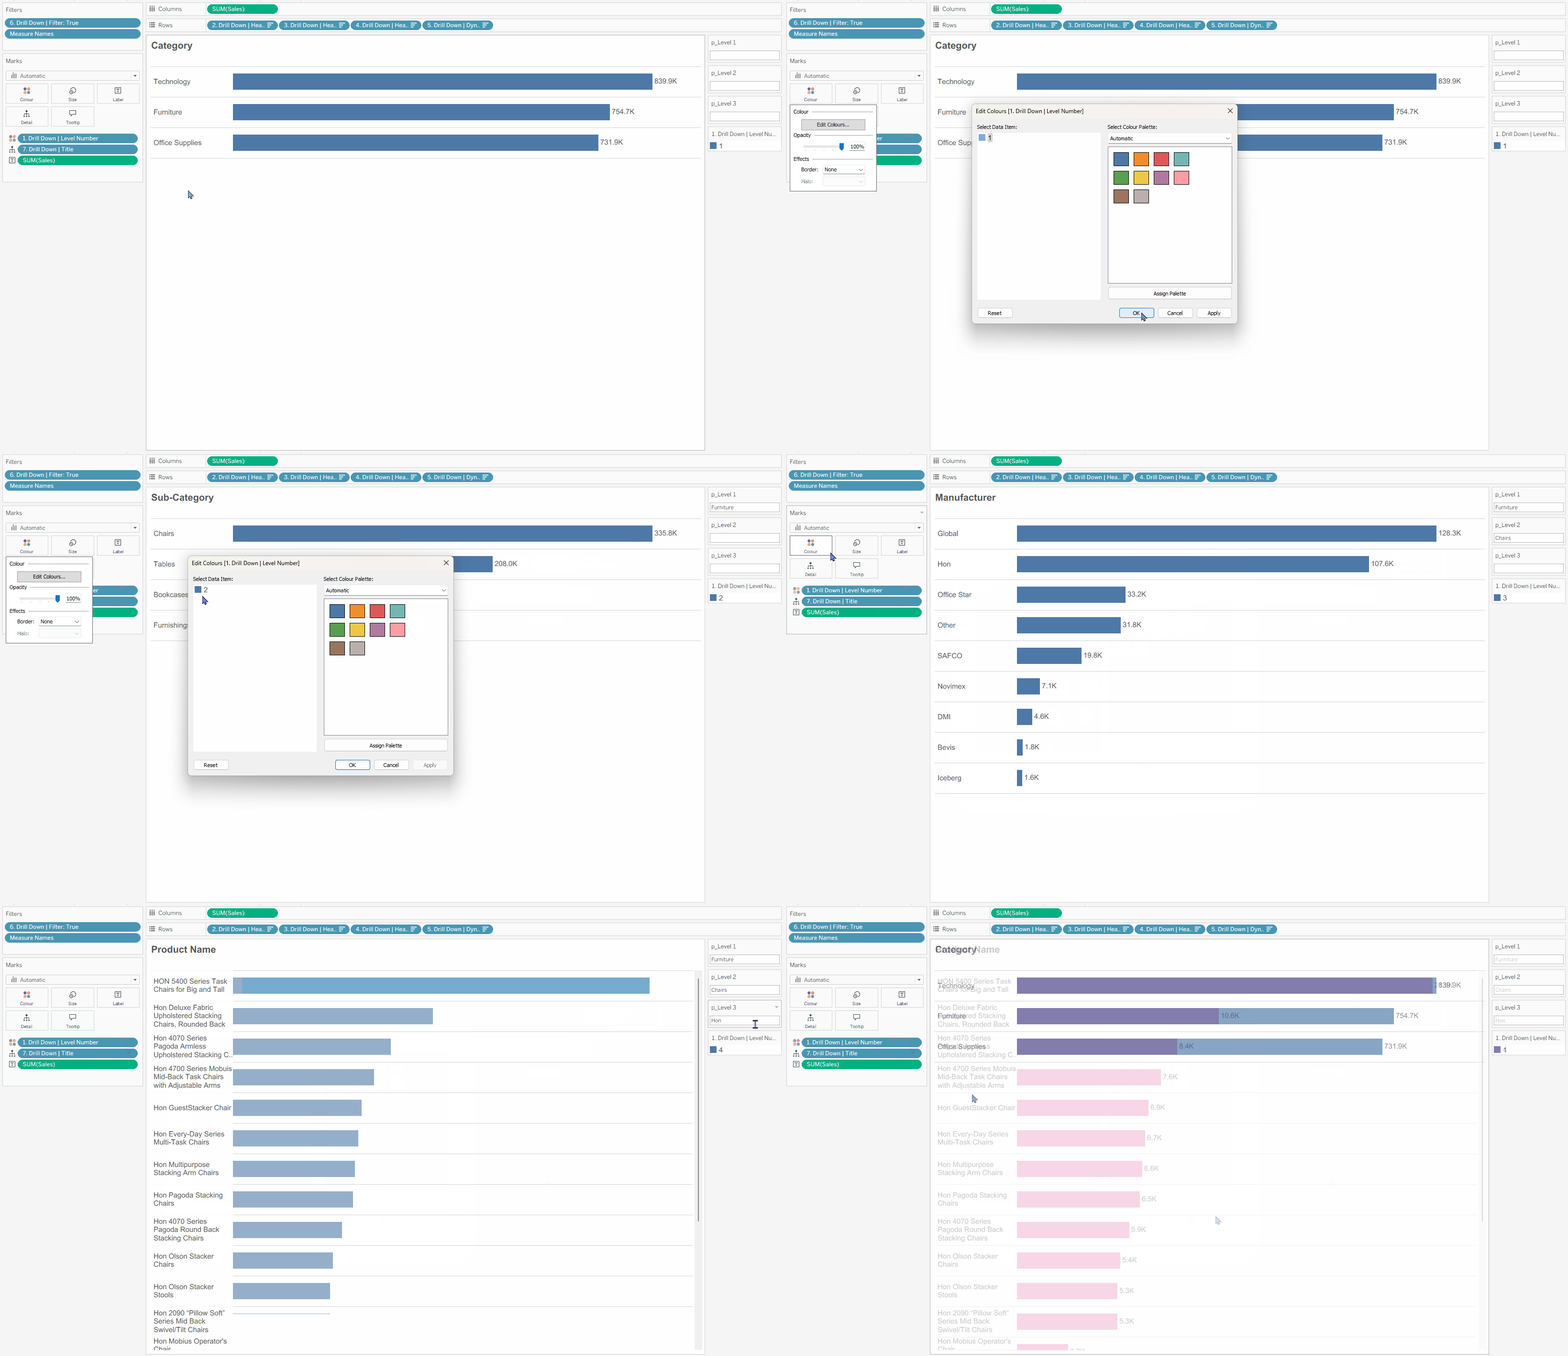
💡 If you don’t want to manually type values into the parameters, you can drill to the next level using the dashboard actions and then navigate back to the worksheet.
This will also prepare the drill-down if you want to combine it with an Elevator display later.
And with that, you’ve created a parameter drill-down! ✨
Combining with an Elevator and Filepath display
One of the benefits of this drill-down method is that it stays clean and uncluttered across multiple levels.
However, to make the navigation even more intuitive, I highly recommend combining it with an Elevator and Filepath display.
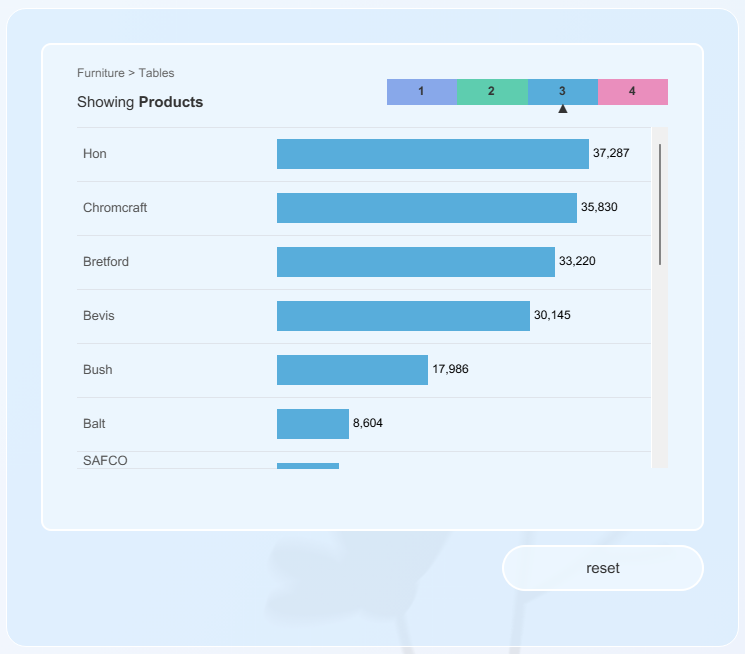
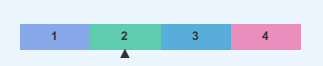
The Elevator display shows the user how many levels are available and where they currently are within the drill-down.
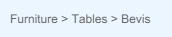
The Filepath display shows which values they selected at previous levels, giving them extra context as they explore the data.
The best part is that, unlike the main drill-down, these are both fairly simple and low-effort to build once the core functionality is working.
To learn how to build these check out the blog below.
If you find this tutorial helpful and give this drill-down method a go, I’d love to see what you create! Feel free to tag me @datavizfairy on Twitter / X or Shreya Arya on LinkedIn ✨